Hello everyone, market enthusiasts and curious minds of the trading world! Today we’re diving into one of the most fascinating and potentially profitable signals the chart can offer us: the Tweezer Bottom. Imagine you’re on a swing, the market goes down, down… and then, suddenly, it encounters an invisible obstacle that pushes it back forcefully twice at the exact same level. It’s as if the price is saying: “No further from here!”
Let’s see together how this “double bottom” can indicate a true bullish reversal and mark the end of a downtrend.
What is the Tweezer Bottom? The Double Support Signal
The Tweezer Bottom is a bullish reversal pattern that typically appears at the end of a bearish trend (downtrend). It is composed of two consecutive candlesticks that share a fundamental characteristic: they have lows (or lower shadows) that are almost identical or exactly at the same level. The name “Tweezer” derives precisely from this similarity, as if two tweezers had “pinched” the price at the same point.
Components of the Pattern:
- First Candlestick: Usually a bearish (red or black) candlestick, with a body indicating that sellers were in control during the session.
- Second Candlestick: Generally a bullish (green or white) candlestick, whose body shows that buyers have started to take control.
- The Crucial Point: The lows (the lowest points touched by the price) of both candlesticks must be almost identical. This is the distinctive and most important element of the pattern.
It might seem like a detail, but this precision in the lows is what makes the Tweezer Bottom such a powerful signal. It’s as if the market, twice in a row, tested a price level and, finding unexpected resistance from buyers, was pushed back.
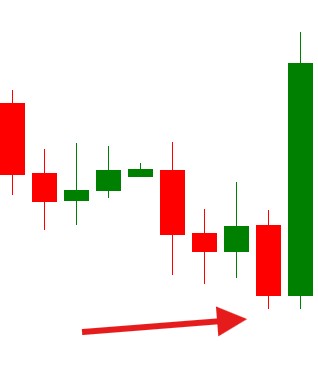 ◎ Rappresentazione del Pattern Tweezer Bottom (Illustration of a Tweezer Bottom with the first bearish candlestick and the second bullish candlestick sharing identical lows.)
The Psychology Behind the Double Bottom
Why should two candlesticks with identical lows indicate a reversal? Imagine a battle. Sellers (bears) are pushing the price down forcefully. They reach a certain point (the first low) and there they encounter some resistance from buyers (bulls), but they still manage to close lower.
In the next session, sellers try again, pushing the price down, back towards that low… but this time, buyers not only withstand the shock, but respond with such force as to make the candlestick close positively. This means that, at that precise price level, there is strong and repeated buying pressure, a real “wall” that prevents the price from falling further. This level becomes a crucial support.
The fact that the price fails to break through that level twice consecutively is a signal of the exhaustion of bearish strength and growing interest from buyers.
How to Recognize and Utilize the Tweezer Bottom in Trading
The Tweezer Bottom is a reversal signal, but as with all patterns, confirmation is crucial. Simply seeing it isn’t enough to plunge headfirst into the market!
Elements of Confirmation:
- Downtrend Context: The Tweezer Bottom is most effective when it appears at the end of a clear and well-defined bearish trend. If you see it in a sideways market, its significance is much less relevant.
- Volume: An increase in volume on the second (bullish) candlestick and/or in subsequent candlesticks can strengthen the pattern’s reliability. High volume indicates that many operators are participating in that “battle” and that buyers are winning convincingly.
- Subsequent Candlesticks: True confirmation comes when the candlestick following the Tweezer Bottom closes higher, preferably surpassing the high of the second candlestick of the pattern. This indicates that the bullish pressure is continuing.
- Support Levels: If the Tweezer Bottom forms at a historical support level (a previous resistance now turned support, an important moving average, or a Fibonacci retracement), its reliability increases exponentially.
 ◎ Pattern Tweezer Bottom with volume indications and subsequent price action (Chart showing a Tweezer Bottom followed by bullish candlesticks and an increase in volume, confirming the reversal.)
Simple Trading Strategy:
- Entry: A conservative entry could be after the close of the confirmation candlestick, or upon breaking above the high of the second candlestick of the Tweezer Bottom.
- Stop Loss: It is crucial to place the stop loss slightly below the common low of the two Tweezer Bottom candlesticks. This loss limit serves to protect capital in case the pattern fails.
- Profit Target: You can use previous resistance levels, risk/reward analysis (e.g., 1:2 or 1:3), or trend exit indicators to define targets.
Conclusion: A Powerful Signal, Not a Crystal Ball
The Tweezer Bottom is a valuable tool in the arsenal of every trader who uses technical analysis. It is a clear and visible signal of how sellers’ strength can exhaust itself precisely where buyers’ strength manifests powerfully and repeatedly.
Remember, however: no pattern is infallible. Technical analysis is an art and a science that requires practice, patience, and the combination of multiple tools. Use the Tweezer Bottom as one of many arrows in your quiver, always in combination with other indicators and with sound risk management.
I hope this analysis is useful for you to recognize and make the most of this interesting pattern. Happy trading everyone!