Hello everyone, financial market enthusiasts and anyone who wants to decipher the secrets of charts! Today, we’re shedding light on one of the most powerful and reassuring reversal patterns you can encounter in technical analysis: the Triple Bottom.
Imagine a stock’s price as an athlete facing a difficult downhill run, a true downtrend. At a certain point, they encounter an obstacle, a kind of invisible “floor” that prevents them from falling below a certain level. Not only do they find it once, but three consecutive times, and each time, they bounce back strongly. Then, with newfound energy, they decide to reverse course and surge decisively upwards. That, my friends, is the Triple Bottom in action. It’s a signal that the support, that invisible line holding the price up, is incredibly strong and that buyers are finally prevailing over sellers.
What is the Triple Bottom?
The Triple Bottom is a bullish reversal pattern that forms at the end of a downtrend. It is characterized by three distinct and approximately equal lows, separated by two intermediate bounces, which form at nearly the same price level. This price area acts as an extremely robust support.
Think of a ball falling and bouncing. If the ball bounces three times from the same spot on the floor without breaking through it, it’s a signal that the floor is solid and that the ball might not break through it; in fact, it might resume an upward trajectory.
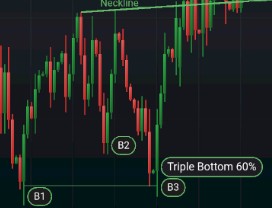 ◎ Grafico del Triplo Minimo: La Struttura (Illustrazione di un grafico con tre minimi di prezzo che toccano un livello di supporto, seguiti da un breakout rialzista.)
How to Recognize a Triple Bottom: Key Distinguishing Features
Recognizing a Triple Bottom isn’t just about “seeing three lows.” There are precise characteristics that make it reliable and increase its probability of success:
- Prior Downtrend: The Triple Bottom must appear after a significant downward price movement. If the price is already in a sideways or uptrend, it is not an authentic Triple Bottom. It is a reversal pattern, not a continuation pattern.
- Three Distinct and Equal Lows: Look for three points where the price drops, touches a support level, and then bounces. These lows don’t have to be identical to the exact penny, but they should be very close to each other, forming a clear and well-defined support area.
- Trading Volumes: This is a crucial aspect for confirmation.
- Often, volume tends to decrease with each low, indicating that selling pressure is exhausting. Sellers, after three failed attempts to break the support, lose confidence and retreat.
- The true signal comes when volume increases significantly during the bullish breakout, confirming the strong entry of buyers and their determination.
- The “Neckline”: This is the horizontal (or slightly upward-sloping) resistance line that connects the highs reached between the first and second lows, and between the second and third lows. This line represents the key level that the price must surpass to confirm the reversal.
- The Breakout: The final confirmation of the pattern occurs when the price convincingly breaks above the neckline, preferably with a significant increase in volumes. This breakout signals that the bearish pressure has ended and that buyers have firmly taken control.
The Psychology Behind the Pattern: Why It Works?
The Triple Bottom is a powerful lesson in market psychology, reflecting a pitched battle between bears (sellers) and bulls (buyers):
- First Low: Sellers are still in control, but buyers begin to find the price attractive at that level, causing a first bounce.
- Second Low: Sellers try again to push the price lower but encounter the same strong resistance from buyers. The fact that they fail to break below the previous low is a first warning sign for them.
- Third Low: Sellers make one last attempt, hoping to break through the support and crash the price. But they fail again, exhausting their strength. At this point, their confidence is eroded, and many begin to close their short positions. Buyers, conversely, see that level as an unbreakable “floor” and start accumulating positions, feeling increasingly confident in the strength of the support. When the price breaks the neckline, it’s as if the buyers collectively declare: “Enough, control is ours now!”
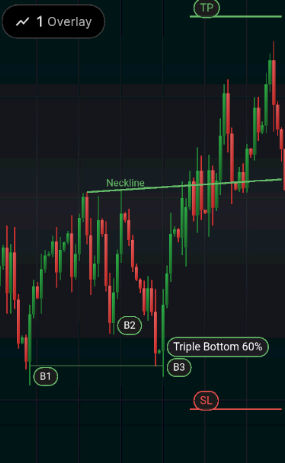 ◎ Anatomia e Punti Operativi del Triplo Minimo (Rappresentazione schematica del pattern Triple Bottom, mostrando i tre minimi, la neckline, il punto di breakout e la proiezione del target di prezzo.)
Trading Strategy and Price Targets
Once a reliable Triple Bottom is recognized, how can we trade to take advantage of it?
- Entry Point: The safest entry is generally after the breakout and the close of a candlestick (or bar) above the neckline, preferably with high volumes. Some traders also wait for a pullback (a return of the price to the neckline, which now acts as support) before entering, for greater confirmation of the reversal.
- Stop Loss: A good point to place the stop loss is strategically just below the neckline, or below the third low, to limit losses in case the breakout turns out to be a “false signal” and the price falls back down.
- Price Target: The potential price target for the Triple Bottom is calculated by measuring the vertical distance from the lowest level of the lows to the neckline and projecting this same distance upwards, starting from the breakout point. For example, if the neckline is at 100 and the lows are at 90, the distance is 10. If the breakout occurs at 100, the potential target is 110.
Final Considerations
The Triple Bottom is a powerful pattern that signals a significant reversal in market sentiment and can offer very interesting trading opportunities. However, like any technical analysis tool, it is not infallible and requires a disciplined approach.
- Confirmation: Always look for confirmation from other indicators (such as RSI, MACD, or moving averages) and, especially, from volume analysis. Volume is the soul of the pattern.
- Patience: Don’t rush. Always wait for the confirmed breakout of the neckline. Entering too early can lead to false signals and frustrations.
- Risk Management: Always use stop losses to protect your capital. Even the most reliable patterns can fail.
Understanding and recognizing the Triple Bottom can provide you with a significant strategic advantage, allowing you to identify potential turning points in the market and enter bullish positions with greater confidence. Keep studying and applying these concepts to real charts; that’s where theory comes alive and becomes skill!
Happy trading!