Hello everyone, market and technical analysis enthusiasts!
In the world of trading, interpreting the signals the market sends us is fundamental for making informed decisions. Today, we’ll delve into a particularly significant chart pattern: the Triple Top. If the Double Top is already a powerful warning sign for a bearish reversal, the Triple Top is like a fire alarm sounding with even greater urgency. It indicates that the bullish momentum has reached its end, completely exhausted.
Get ready to discover how to recognize this pattern and why it’s such a reliable sign of exhausted bullish strength.
What is the Triple Top?
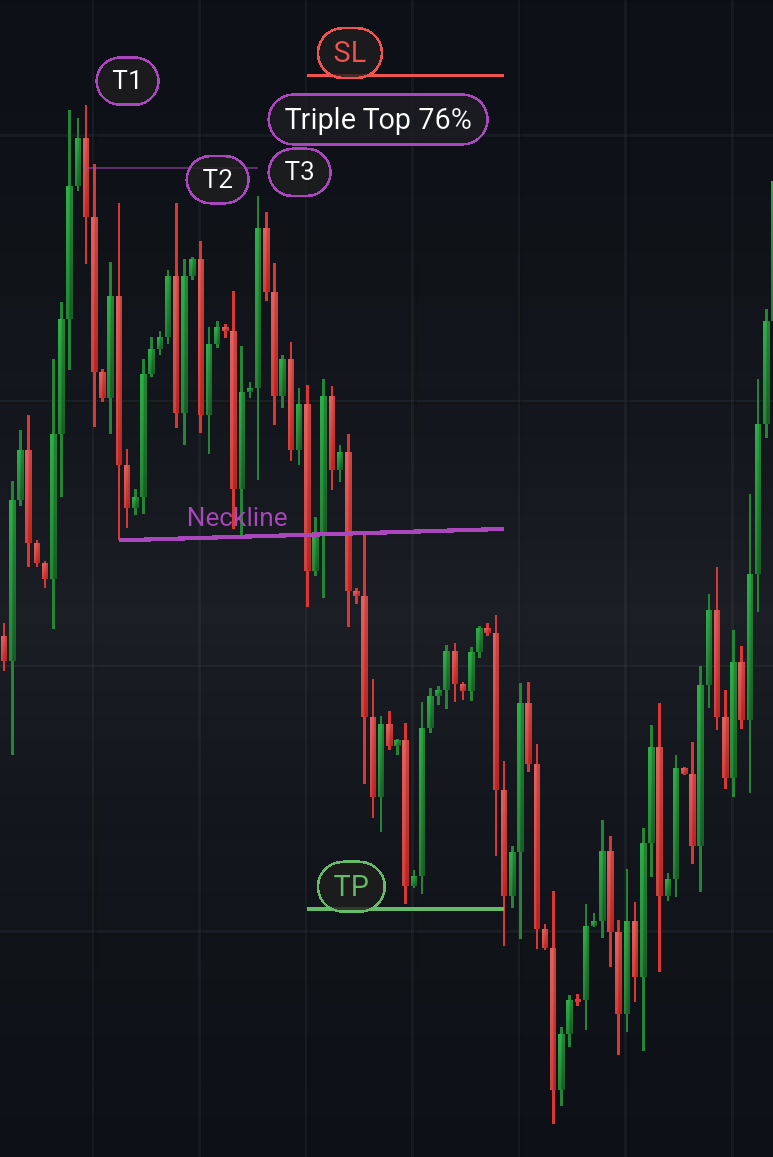
Imagine the price of an asset is rising, showing a strong uptrend. Then, it reaches a peak (the first top) and retraces slightly. As soon as it attempts to resume its ascent, it reaches a price level very similar to the previous one (the second top) and retraces again. Finally, for the third time, it tries to break through that “wall,” but fails miserably, forming a third top approximately at the same level as the first two.
This is the Triple Top: a bearish reversal pattern consisting of three consecutive tops that form approximately at the same price level, separated by two intermediate lows. These intermediate lows define a neckline, which serves as crucial support for the price.
 ◎ Identificazione del Triplo Massimo su un grafico (A candlestick chart showing three nearly equal price peaks followed by a support line (neckline) that is broken downwards, indicating a reversal.)
Why is it an Even Stronger Exhaustion Signal? The Psychology Behind the Pattern
The Triple Top is considered a more powerful signal than the Double Top precisely because of its repetitive nature of failure. Think about it:
- First Top: Buyers push the price up, but encounter resistance or sellers. The price retraces.
- Second Top: Buyers try again, but face the same resistance. Failure here generates a Double Top, a warning signal.
- Third Top: Instead of giving up, buyers attempt a third time to break that level. This third attempt, which fails once more, unequivocally demonstrates that buying pressure is completely exhausted. It’s like an athlete trying to lift a weight three times and failing all three times; eventually, it’s clear they don’t have the necessary strength.
Each failed attempt to overcome resistance reinforces the sellers’ conviction and the buyers’ disillusionment. Exhausted buyers begin to close their positions or even open short positions, while sellers become more aggressive. This leads to a decisive breakdown of the neckline, signaling the beginning of a potential downtrend.
How to Identify a Triple Top: Key Elements
To correctly identify a Triple Top, it’s important to pay attention to these details:
- Three Distinct Tops: The three peaks must be well-defined and approximately at the same price level. Small variations are normal, but the idea is that the price consistently finds the same “insurmountable resistance.”
- Intermediate Lows and Neckline: Between one top and the next, two lows form. Connecting these lows draws the neckline. This line is the critical support that, once broken, validates the pattern.
- Volume: Trading volume is a crucial indicator. Generally, a decrease in volume is observed on successive tops. This indicates that buyers’ enthusiasm is waning. Conversely, when the price breaks the neckline, a significant increase in volume should be observed, confirming that a large number of market participants are acting on this signal.
 ◎ Triplo Massimo e il ruolo del volume (A chart illustrating a Triple Top, showing decreasing trading volume during the formation of the three tops and increasing volume at the time of the neckline breakout.)
Measuring the Price Target
Once the Triple Top is confirmed (i.e., the neckline has been broken downwards with significant volume), it’s possible to estimate a potential price target. The general rule is to measure the vertical distance from the level of the tops to the neckline and project this distance downwards from the neckline’s breakout point.
- Distance (H) = Level of Tops - Level of Neckline
- Price Target = Neckline Breakout Point - H
This target is a guide, not a guarantee, but it offers an idea of the potential downward movement.
Confirmations and Precautions
As with any technical analysis pattern, it’s crucial not to base your decisions on a single signal.
- Breakout Confirmation: The breakout of the neckline is the most important confirmation. Ideally, it should occur with high volume and a close below the neckline.
- Retest Rallies (Pullback): Often, after the breakout, the price may perform a “pullback” (a brief rally) to retest the neckline (which now acts as resistance). A failure of this retest further strengthens the bearish signal.
- Combine with Other Indicators: To increase reliability, combine the Triple Top with other technical indicators. For example, a bearish divergence on the RSI or MACD forming during the Triple Top’s formation can reinforce the reversal signal. Analyzing moving averages can also provide additional confirmation.
Triple Top vs. Double Top: The Difference in Strength
While the Double Top indicates that buyers have failed twice to overcome resistance, the Triple Top signals a failure repeated three times. This third failure is often the straw that breaks the camel’s back, indicating a much deeper bullish exhaustion and a higher probability of a lasting and significant trend reversal. Sellers’ persistence and buyers’ disillusionment are at their maximum.
Conclusion
The Triple Top is one of the most powerful and reliable reversal patterns in technical analysis. Its formation tells a clear story of exhausted bullish strength and an impending takeover by sellers. Learning to identify it correctly, paying attention to price levels, the neckline, and, most importantly, volume, can give you a valuable edge in your trading decisions.
Always remember that no pattern is infallible, and risk management is fundamental. But once you’ve learned to recognize the Triple Top, you’ll have a powerful tool to anticipate market movements and protect your investments.
Happy trading everyone!