The Three Pillars of Technical Analysis: The Market Discounts Everything, Prices Move in Trends, History Repeats Itself
Hello everyone, market enthusiasts and finance curious! Today, we’ll dive into the beating heart of technical analysis, exploring the three fundamental principles upon which the entire discipline rests. If you’ve ever looked at a chart thinking “but how does all this move?”, you’re in the right place. These pillars are not just theories, but true lenses through which chartists (that’s us!) interpret market behavior.
Get ready to discover how price tells us a complete story, how it tends to move in predictable directions, and why the past is often a precursor to the future.
Principle 1: The Market Discounts Everything
This is perhaps the most powerful principle and, at times, the most difficult to accept for those accustomed to fundamental analysis. What exactly does “the market discounts everything” mean? It means that every single piece of available information — from macroeconomic data to company earnings, from political news to unexpected events, right down to future expectations and the collective psychology of operators — is already incorporated into an asset’s current price.
Think of the price as a sponge that has absorbed every drop of existing information. It doesn’t matter if the information is public, private, rational, or based on rumor; the moment it enters the operators’ information system, it translates into buying or selling decisions that influence the price.
Implication for the Technical Analyst: If the price discounts everything, then there’s no need to analyze company balance sheets, predict central bank moves, or speculate on the government’s next action. The technical analyst believes that all this “noise” is already condensed into the only thing that truly matters: price movement. All we need is the chart.
Illustrative Example: Imagine a tech company expected to release a revolutionary product. Fundamental analysts might spend months studying patents, production capabilities, and market potential. The technical analyst, on the other hand, simply observes the price. If the news of the revolutionary product is met with great enthusiasm, it’s very likely that the stock’s price has already started to rise in the weeks or months leading up to the official announcement, reflecting investors’ expectations. On the day of the announcement, paradoxically, the stock might even drop, because the “buy the rumor, sell the news” event has already discounted expectations, and traders are now taking profit.
 ◎ Il prezzo che anticipa le notizie (Grafico lineare di un’azione che mostra un forte aumento prima di un evento atteso e un calo dopo l’annuncio, illustrando il concetto di “compra sul rumor, vendi sulla notizia” dove il mercato sconta in anticipo le informazioni.)
Principle 2: Prices Move in Trends
This principle is the bread and butter of every technical trader. If prices moved completely randomly, trading would be pure gambling. Fortunately (for us!), that’s not the case. Prices tend to move in relatively predictable directions, which we call trends.
A trend is simply a persistent direction in price movement. We can distinguish three main types of trends:
- Uptrend: Characterized by a sequence of higher highs and higher lows. The market is rising.
- Downtrend: Characterized by a sequence of lower highs and lower lows. The market is falling.
- Sideways/Range-bound Trend: When prices move within a well-defined range, without a clear bullish or bearish direction.
Implication for the Technical Analyst: Identifying the dominant trend is the first step for a technical trader. The most profitable approach is often to “trade with the trend,” meaning to buy in an uptrend and sell (or short) in a downtrend. It’s like navigating: it’s much easier and safer to go with the current than against it.
Illustrative Example: Let’s take a stock that is in a clear uptrend. Every time the price pulls back slightly, it fails to drop below the previous low and resumes its ascent, surpassing the previous high. This pattern of higher highs and higher lows indicates that buying pressure is dominant. A technical trader will look to enter during pullbacks, anticipating the resumption of the main trend. Conversely, a stock in a downtrend will consistently show lower highs and lower lows, and a trader will seek bearish positions.
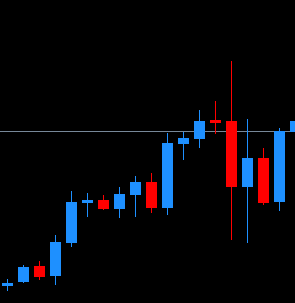
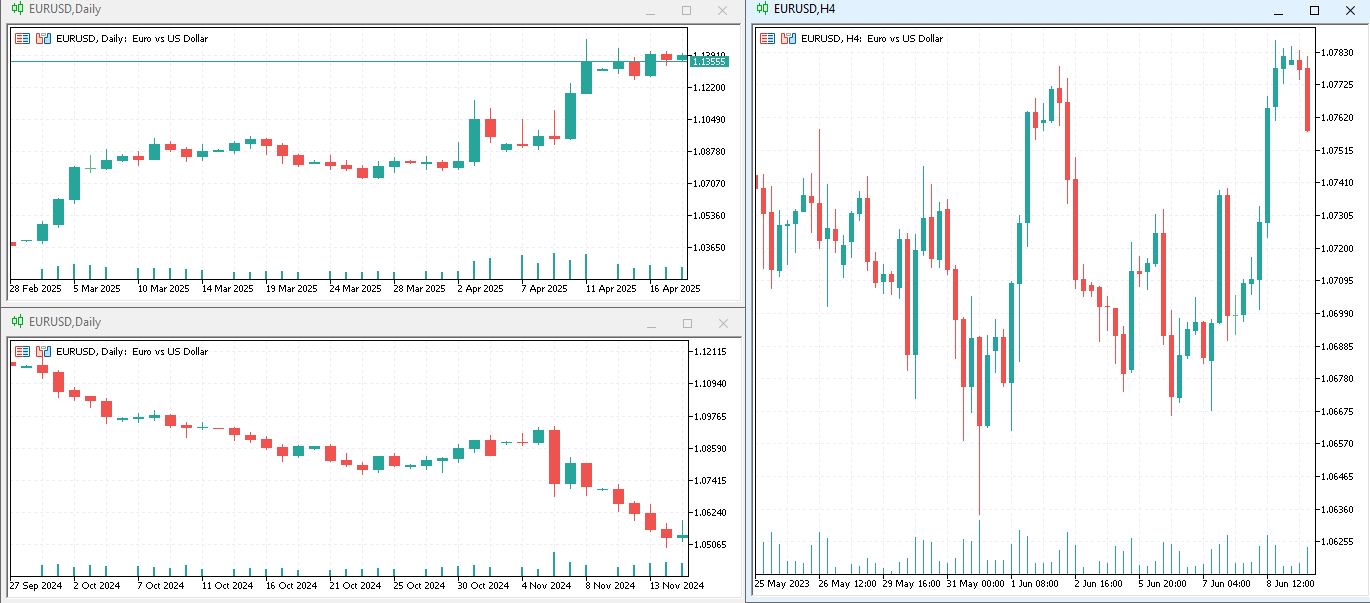 ◎ Esempi di trend: rialzista, ribassista e laterale (Illustrazione grafica dei tre principali tipi di trend nei mercati finanziari: uptrend, downtrend e movimento laterale.)
Principle 3: History Repeats Itself
This principle is based on human psychology, which tends to remain unchanged over time. Market participants react to similar situations in similar ways, driven by fear, greed, euphoria, or panic. This consistency in collective behavior translates into recognizable patterns on price charts.
Chart patterns, price formations, and technical indicators that have worked in the past have a good probability of working in the future as well, because they reflect the same human psychology that originally created them.
Implication for the Technical Analyst: By studying historical patterns, technical analysts seek to anticipate future price movements. Recognizing a bearish “head and shoulders” formation, for example, can suggest an imminent trend reversal from bullish to bearish, because in the past, that formation has often preceded price drops. Similarly, support levels (where price tends to bounce upwards) and resistance levels (where price tends to bounce downwards) tend to reappear, due to the market’s collective memory.
Illustrative Example: Consider the reversal pattern called the “double top.” It forms when the price attempts twice to break above a certain resistance level, failing both times and forming two peaks at approximately the same level. Between the two peaks, there is a trough. A downward break of the “neckline,” which is the low between the two peaks, is often a strong signal of a bearish reversal. This pattern has repeated countless times in market history, and traders use it as a signal to open short positions or close long positions. The logic is that if, in the past, most traders reacted in a certain way to this configuration, they will likely do so again this time.
Conclusion: The Simple Power of Technical Analysis
These three principles are the rock upon which technical analysis is built. They are not just abstract concepts, but practical tools that allow traders to navigate the complexity of financial markets with a clear and replicable methodology.
Understanding that the market has already absorbed all information, that prices move in persistent directions (trends), and that historical patterns repeat due to human nature, gives you a solid foundation to begin your journey into chart analysis.
Remember, technical analysis is not a crystal ball, but a system of probabilities. These principles increase our chances of success, allowing us to make more informed decisions based on objective price behavior.
I hope this in-depth exploration has been useful to you. If you have any questions or want to share your experiences, leave a comment below! Until the next article!