In the dynamic world of trading, the ability to anticipate market movements is crucial. Often, it’s not just about spotting a signal, but about seeking confirmation, almost like a detective looking for evidence to validate a hypothesis. Today, we’ll explore a Japanese candlestick pattern that does just that: the Three Inside Down, a powerful bearish reversal signal that acts as robust confirmation for another crucial pattern, the Bearish Harami.
If the Bearish Harami is the alarm bell, the Three Inside Down is the deafening sound of the siren shouting: “Warning, the trend is about to change!”
The Bearish Harami Pattern: A First Signal
Before diving into the strength of the Three Inside Down, let’s take a step back and understand its predecessor, the Bearish Harami.
Imagine a strongly rising market, with prices continuing to climb day after day. At some point, an unusual candle appears:
- Day 1: A very long green (bullish) candle, reflecting strong buying pressure and the continuation of the uptrend.
- Day 2: A much smaller red (bearish) candle, whose body is completely “engulfed” or contained within the body of the previous candle. It almost looks like the red candle is “pregnant” with the green one – hence the name “Harami”, which means “pregnant” in Japanese.
This pattern suggests a loss of momentum from buyers and the entry of some indecision into the market. It’s as if the bullish train’s engine starts to stutter. It’s an alert signal, a potential warning of an imminent reversal, but not a definitive confirmation. It needs “further evidence”.
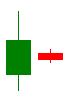 ◎ Pattern Harami Ribassista: Il primo avviso (Illustrazione di un grafico a candele con un pattern Harami ribassista: una candela verde lunga seguita da una candela rossa piccola e contenuta al suo interno.)
The Three Inside Down: The Decisive Confirmation
And this is where the Three Inside Down comes into play, transforming a suspicion into near certainty. This pattern is composed of three candles and develops right after a Bearish Harami, acting as its confirmation.
Let’s look at its construction:
- Candle 1 (Day 1): A long, strong green (bullish) candle, representing the final phase of the uptrend. This is the same first candle of the Bearish Harami.
- Candle 2 (Day 2): A small red (bearish) candle, whose body is entirely contained within the body of the first candle. This is the second candle of the Bearish Harami. Up to this point, we have a complete Bearish Harami.
- Candle 3 (Day 3): The crucial candle. A long and powerful red (bearish) candle, which forms below the close of the second candle and, most importantly, closes below the open price of the first green candle.
Why is it so powerful?
The Three Inside Down tells us a clear story:
- Day 1: Bulls dominate, the uptrend is strong.
- Day 2: Indecision appears (Harami). Bulls can no longer push prices significantly higher, and sellers begin to make their presence felt, albeit cautiously.
- Day 3: Sellers (bears) decisively take control. The third candle not only confirms the change in sentiment, but its close below the open of the first candle (which symbolized the bulls’ strength) indicates a clear defeat for buyers and an assertion of sellers’ power. It’s as if the bullish train, after sputtering, hit the emergency brake and started moving backward.
How to Interpret and Trade
Identifying the Three Inside Down is a valuable skill, but how to use it in trading?
- Context is King: This pattern is much more reliable when it appears after a clear and prolonged uptrend. Its appearance in a sideways or volatile market holds less significance. Look for its formation near significant resistance levels.
- Volume: An increase in volume on the third red candle further strengthens the signal. It means the reversal is supported by significant participation from traders.
- Additional Confirmations: No pattern is infallible. Combine the Three Inside Down with other technical analysis tools:
- Momentum Indicators: An RSI (Relative Strength Index) in overbought territory starting to decline, or a MACD (Moving Average Convergence Divergence) showing a bearish crossover, can act as further confirmations.
- Moving Averages: A downside break of key moving averages can amplify the signal.
- Trading Strategy:
- Short Entry: A sell (short) operation can be considered after the close of the third candle, or at the open of the next day.
- Stop Loss: To manage risk, place the stop loss above the high of the first candle (or the second, if higher). This point represents the level beyond which the reversal hypothesis would be invalidated.
- Profit Target: Potential profit targets can be identified using previous support levels, Fibonacci retracements, or other technical analysis techniques.
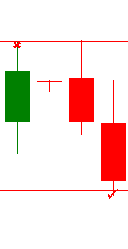 ◎ Esempio di Trading con il Three Inside Down (Grafico a candele che mostra un pattern Three Inside Down, con linee indicative per il punto di ingresso short, lo stop loss sopra la prima candela e un potenziale target di profitto a un livello di supporto inferiore.)
Pay Attention to Details and Risks
Like any technical analysis tool, the Three Inside Down is not infallible. “False signals” exist. The market is influenced by multiple factors (economic news, unforeseen events) that can invalidate even the most reliable patterns.
It is crucial to always use proper risk management and not rely on a single signal to make trading decisions. A holistic approach that combines candlestick analysis, technical indicators, fundamental analysis, and capital management is always the winning strategy.
Conclusion
The Three Inside Down is a powerful pattern because it not only signals a potential change in direction but confirms it with a clear demonstration of bearish strength. It transforms a warning (the Bearish Harami) into a call to action, indicating that sellers have taken over.