Hello everyone, market enthusiasts and price movement curious minds! Today we will dive into the heart of technical analysis to unveil a Japanese candlestick pattern that, despite its somewhat ominous name, is a valuable ally for those navigating the markets: the Three Black Crows (Tre Corvi Neri). If you’ve ever wondered what happens when a trend seems to lose momentum and bears take over, this article is for you!
What Are the “Three Black Crows”? An Unequivocal Signal
Imagine the market as a constant battle between buyers (bulls) and sellers (bears). A pattern like the Three Black Crows is like seeing the sellers’ infantry advance for three consecutive days, without respite.
Specifically, the Three Black Crows is a bearish reversal pattern that forms when there are three long and consecutive bearish candlesticks. Sounds simple, right? But the details matter:
- Three Long Bearish Candlesticks: Each candlestick must close in negative territory, preferably with a significant body, indicating decisive selling pressure.
- Open Within or Near Previous Close: Each subsequent candlestick should ideally open within the body of the previous candlestick, or at least not significantly higher. This suggests that, despite initial buyer efforts or a neutral open, sellers immediately take control.
- Close at or Near Lows: Lower shadows should be short or non-existent. This is a crucial signal: it indicates that sellers maintained control throughout the session, pushing the price down to the close and not allowing buyers to recover ground.
This pattern usually appears after a prolonged uptrend or a period of consolidation at highs. It’s as if the market, which was rising, suddenly faced a wall of sellers unwilling to yield.
 ◎ Esempio del pattern Three Black Crows (Rappresentazione grafica delle tre candele ribassiste consecutive che formano il pattern Three Black Crows, con corpi lunghi e ombre inferiori minime.)
The Psychology Behind the Crows: Consistent Selling Pressure
The name “Three Black Crows” evokes an image of ill omen, and in trading, it’s not far from the truth. This pattern tells a story of shifting market sentiment:
- The First Crow: It’s a warning. After a period of optimism, a long bearish candlestick appears. Some buyers might still think it’s an opportunity to “buy the dip,” but the sellers’ strength is evident.
- The Second Crow: The signal strengthens. Sellers continue to dominate, pushing the price even lower. At this point, even the most stubborn buyers start to feel uncomfortable. Hopes of a rebound fade.
- The Third Crow: The confirmation of the decline. The third day sees uninterrupted selling pressure, with the price closing even lower. This is when remaining buyers throw in the towel and many start liquidating their positions, contributing to accelerating the descent.
It’s like a car climbing a steep hill suddenly starts losing power, then its wheels slip, and finally, it slides backward. Each crow represents another step backward, a loss of momentum that turns into a full-blown retreat.
How to Use the Three Black Crows in Your Analysis
Identifying the Three Black Crows is the first step, but how can we leverage it in our trading strategy?
- Context is Key: Remember, this pattern is more powerful if it forms after a significant uptrend. If it appears in a sideways or already bearish market, its meaning as a “reversal” is less relevant.
- Seek Confirmation: No pattern is infallible. To increase reliability, look for confirmation from other indicators or subsequent price action. You might observe:
- Increased Volumes: If the three bearish candlesticks are accompanied by an increase in trading volumes, this strengthens the idea that selling pressure is real and massive.
- Support Breakout: If the pattern forms near a significant support level and breaks it, the bearish signal is even stronger.
- Momentum Indicators: RSI, MACD, or Stochastic showing bearish divergences or entering overbought zones and then reversing can provide further confirmation.
- Risk Management: If you decide to act on the bearish signal, it’s crucial to set a stop-loss. A logical point could be above the high of the first bearish candlestick or, more aggressively, above the high of the third candlestick. This limits losses in case the pattern turns out to be a “false alarm.”
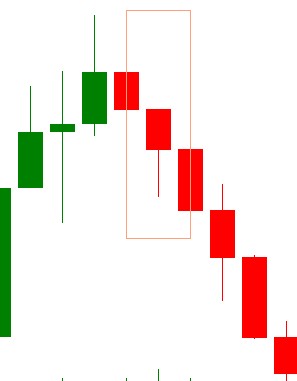 ◎ Esempio dei Three Black Crows su un grafico di mercato (Un esempio di come il pattern Three Black Crows appare su un grafico dei prezzi, evidenziando la sua posizione dopo un trend rialzista e la successiva inversione ribassista.)
Conclusion: Listen to the Crows’ Message
The Three Black Crows are a clear example of how Japanese candlesticks can tell a clear and visual story about market sentiment. They are not just a “drawing” on the chart; they are a snapshot of the battle between bulls and bears, which in this case sees the bears firmly taking control.
Understanding and being able to interpret this pattern will give you a significant advantage, allowing you to anticipate potential reversals and act more informedly. Always remember that technical analysis is both an art and a science, and the effectiveness of any pattern increases when combined with careful risk management and other forms of analysis.
Happy trading everyone, and may your charts speak clearly to you!