Head and Shoulders: The Classic Bearish Reversal Pattern
Hello everyone, market enthusiasts and those curious about technical analysis! Today we dive into one of the most iconic and reliable chart patterns: the Head and Shoulders. This pattern isn’t just a pretty drawing on the chart; it’s a true story the market tells us, often a prelude to a significant reversal, particularly a bearish reversal. If you’re here to understand how to identify these signals and, most importantly, how to use them to your advantage, you’re in the right place.
Imagine the price chart as a landscape showing us the collective mood of buyers and sellers. The Head and Shoulders is like a human silhouette emerging from this landscape, indicating that the bullish party is about to end and that a bearish reversal is on the horizon. It’s a powerful signal, often studied and respected by traders and analysts worldwide.
What is the Head and Shoulders Pattern?
The Head and Shoulders is a bearish reversal pattern. This means it typically forms after a prolonged bullish trend and signals a probable reversal downwards. Its strength lies in the underlying supply and demand logic it reflects.
The pattern consists of three distinct “peaks,” connected by a horizontal or slightly sloping support line, called the Neckline. It looks just like a head with two shoulders, hence the name!
Key Elements: A Detailed Journey
To fully understand the Head and Shoulders, let’s analyze its components:
The Left Shoulder
It’s the first peak that forms after a significant bullish trend. The price rises, forms a high, and then pulls back slightly. This pullback is often accompanied by high trading volume, typical of an ongoing bullish trend.
The Head
After the left shoulder, the price resumes its ascent, surpassing the previous peak and creating a new, higher, high. This is the highest point of the entire pattern. Here too, volume should be significant, but often lower than that of the left shoulder, indicating that the bullish strength is waning. After reaching this peak, the price pulls back again, falling to or near the support level reached after the left shoulder.
The Right Shoulder
The price attempts one last rally, but fails to surpass the Head’s high. It forms a peak lower than the Head, but ideally similar in height to the Left Shoulder. This failure to reach new highs is a crucial signal of weakness. During the formation of the right shoulder, volumes are usually significantly lower than previous peaks, confirming the lack of interest and “fuel” to sustain the bullish trend. After forming this peak, the price begins a more decisive descent.
The Neckline
This is the vital line of the pattern! It’s a support line drawn by connecting the two low points that form between the left shoulder and the head, and between the head and the right shoulder. The Neckline can be horizontal or slightly sloping (upwards or downwards). Its breakout is the most important reversal signal.
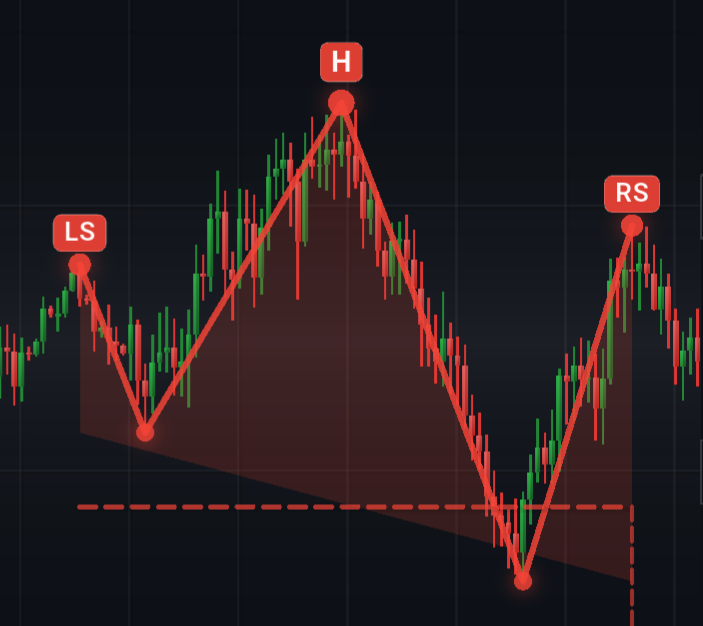 ◎ Composizione del Pattern Testa e Spalle Ribassista (Un diagramma che illustra chiaramente la spalla sinistra, la testa, la spalla destra e la neckline del pattern Testa e Spalle.)
The Crucial Role of Volumes
Trading volumes are your best friend in Head and Shoulders analysis. They act as a market ’energy meter':
- Left Shoulder: High volume, typical of a strong bullish trend.
- Head: Volume often lower than the left shoulder, suggesting a decrease in bullish strength, even if the price rises to a new high.
- Right Shoulder: Significantly lower volume than previous peaks, a clear sign of buyer interest exhaustion.
- Neckline Breakout: An increase in volume when the price breaks the Neckline is crucial. This confirms that many traders are abandoning their long positions and that significant selling pressure is at play. Without a volume increase on the breakout, the signal is less reliable and could be a “false breakout.”
How to Confirm the Signal: The Breakout
The true operational signal occurs when the price convincingly breaks the Neckline downwards, closing a candlestick (or multiple candlesticks) decisively below it. Often, after the breakout, the price may perform a pullback, which is a retracement towards the Neckline (which now acts as resistance) before resuming its decline. This pullback offers an entry opportunity for traders who missed the initial breakout.
Calculating the Price Target: Your Compass
One of the most interesting aspects of the Head and Shoulders is the ability to calculate a minimum price objective (target). This measurement is quite reliable and provides traders with a concrete indication of where the price might be headed.
Here’s how to do it:
- Measure the height: Calculate the vertical distance from the highest point of the Head to the Neckline.
- Project: Take this distance and project it downwards from the point where the price broke the Neckline.
The resulting value will be your minimum price target for the bearish move.
 ◎ Come calcolare il target di prezzo del Testa e Spalle (Un grafico che mostra la misurazione dell’altezza dalla testa alla neckline e la sua proiezione al ribasso per determinare il target di prezzo.)
For example, if the distance from the top of the Head to the Neckline is 10 points and the Neckline is broken at 100, the minimum target will be 90.
Validity and Important Considerations
- It’s not infallible: No technical analysis pattern is. Always use it in combination with other tools and indicators (e.g., momentum indicators, support/resistance levels).
- Breakout confirmation: The importance of volume on the Neckline breakout cannot be overstated. A low-volume breakout is suspect.
- Pullback: If the price performs a pullback to the broken Neckline, which now acts as resistance, and then resumes its decline, it’s further confirmation of the signal.
- Risk management: Always set a stop-loss above the right shoulder (or the Neckline, depending on your risk tolerance) to protect yourself from unexpected reversals or false breakouts.
Conclusion
The Head and Shoulders pattern is a powerful ally in your technical analysis arsenal. Recognizing it, understanding the underlying volume logic, and knowing how to calculate the price target will give you a significant advantage in predicting potential bearish reversals. Remember, practice makes perfect. Observe charts, look for this pattern, and try to identify its elements. Soon, you’ll see it emerge with clarity, guiding you in your trading decisions.
Keep studying, practicing, and applying what you learn. Markets are an inexhaustible source of opportunities for those who can read their signals!