Hello everyone, market enthusiasts and technical analysis curious!
We’re back with the second part of our journey into Dow Theory, the pillar upon which much of modern technical analysis is built. If in Part 1 (link to Part 1) we introduced the fundamental principles and the importance of trend, today we will delve into the beating heart of market cycles, exploring how trends develop through its three main phases: Accumulation, Public Participation, and Distribution.
Understanding these phases is not just a theoretical exercise, but a true magnifying glass for gauging the market’s pulse and, who knows, anticipating its most important movements. Imagine being able to read the story the chart is telling you, like an open book on investors’ intentions. Ready? Let’s begin!
The Market: A Living Organism with Its Phases
Dow saw the market as a living organism, breathing and moving through well-defined cycles, often driven by the collective psychology of investors. Every bullish cycle (or bull market) goes through three distinct stages, which follow one another in a logical and predictable order. Recognizing them is key to positioning oneself optimally.
Phase 1: Accumulation (The Trend’s “Seed”)
Imagine a gardener planting seeds in winter, when the ground is cold and many doubt that anything could ever grow. This is the Accumulation phase.
- What happens: It is the initial phase of a bull market (or the end of a bear market). General sentiment is still negative or indifferent. News and forecasts are often pessimistic. Long-term investors and “strong hands” (large institutions, funds, experienced investors) begin to acquire assets, often counter-trend, when prices are at their lows and no one wants to buy. They do so gradually, without making noise.
- How to recognize it graphically:
- The market moves sideways, after a period of sharp decline. It looks “stuck” or “flat”.
- Trading volume is often low, but may start to show small spikes or a slight increase on rallies, while decreasing on pullbacks.
- Solid bases are formed, often with lows that stop declining or start to be slightly higher than previous ones.
- Volatility is compressed.
- Metaphor: It’s the calm before the storm (of optimism).
 ◎ Esempio Grafico di una Fase di Accumulazione (A line chart showing a sideways price phase after a decline, with volumes starting to rise on small rallies, indicating accumulation.)
Phase 2: Public Participation (The Trend’s “Growth”)
After the seeds have been planted and the first seedlings have emerged, the gardener (experienced investors) begins to see the fruits of their labor. When the seedlings become visible to everyone, many others decide to join in.
- What happens: It is the most extensive and dynamic phase of a bull market. The upward trend is now evident and recognized by a growing number of investors, including trend followers, individual investors, and financial media. Sentiment shifts from neutral to optimistic and then to euphoric. News becomes increasingly positive and forecasts bullish.
- How to recognize it graphically:
- The price begins a clear and sustained upward trend, with rising highs and lows.
- Trading volume increases significantly, a sign of growing interest and participation.
- Breakouts from consolidation patterns (flags, triangles, etc.) occur.
- Corrective movements are shallower and less lasting.
- Metaphor: The tree grows lush, attracting everyone’s attention.
Phase 3: Distribution (The “Harvest” and the End of the Trend)
The plants have yielded their fruits, the harvest is abundant, and people are enthusiastic. It’s time for the gardener to sell their produce, while everyone else is convinced the party will last forever.
- What happens: It is the final phase of a bull market (or the beginning of a bear market). Sentiment is now euphoric, almost irrational. Everyone is talking about the market, even those who usually don’t bother with it. The “smart money” investors (those who accumulated early) gradually begin to sell their positions and collect profits, transferring their shares to the enthusiastic public who buys at the highs, convinced that the rally will continue indefinitely.
- How to recognize it graphically:
- The market moves sideways again, forming a “top” after a strong rally.
- Volatility may increase, with large price movements that, however, fail to sustain new significant highs.
- Volume may remain high, but volume spikes are observed on declines or failed upward breakouts.
- Reversal patterns (double tops, head and shoulders, etc.) may form.
- Highs become less convincing, and lower highs than previous ones may start to be seen.
- Metaphor: The party is about to end, and those who arrived first are already packing their bags.
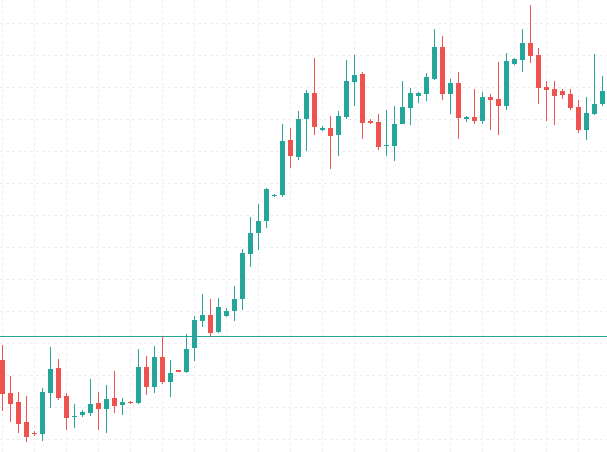
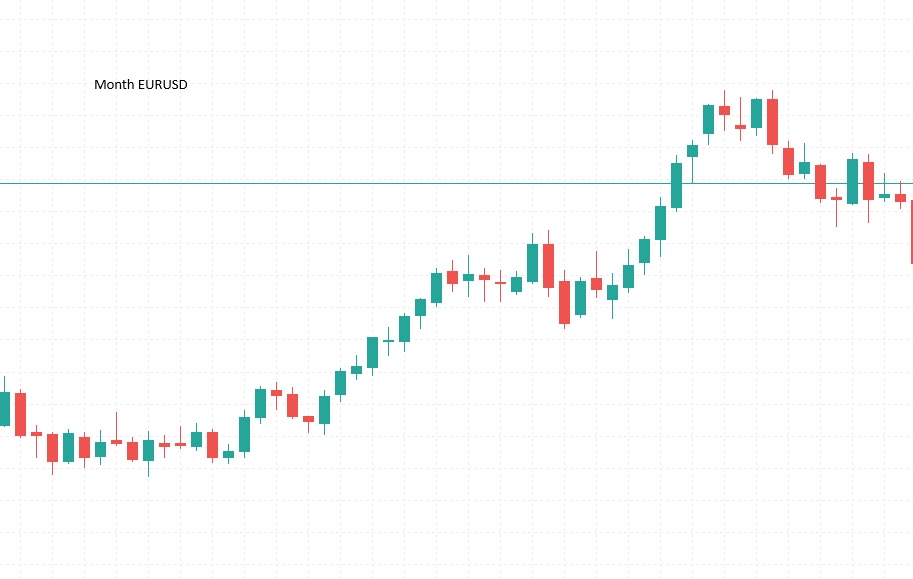 ◎ Illustrazione del Ciclo di Mercato con le tre Fasi di Dow (A stylized chart showing an entire market cycle: starting with a flat accumulation base, followed by a strong rally in the public participation phase, and ending with a sideways or erratic distribution phase before a decline.)
Why Is It Important to Recognize These Phases?
Understanding Dow’s phases is fundamental for a conscious trader or investor:
- Timing: Helps identify potentially best times to enter (during accumulation, to anticipate public participation) and to exit (during distribution, before the market turns downwards).
- Psicologia: Allows you to tune into market psychology. If everyone is euphoric, it might be time to be cautious. If everyone is desperate, there might be an accumulation opportunity.
- Risk Management: Understanding which phase we are in helps to calibrate the risk of one’s operations. Buying during the distribution phase is much riskier than doing so during the accumulation phase.
Conclusion
Dow’s three market phases – Accumulation, Public Participation, and Distribution – offer us a valuable map for navigating the complexity of financial markets. They are not rigidly defined watertight compartments, but rather continuous nuances and transitions that require practice and observation to master.
Technical analysis is not a crystal ball, but a powerful interpretive tool. Dow Theory, with its emphasis on psychological cycles and price and volume movements, remains an indispensable foundation for anyone who wants to understand “what’s happening” on the chart.
In the next article, we will explore other key principles of Dow Theory, such as the importance of volume and confirmation between indices. Stay tuned!
Until next time, and happy trading!