Support and Resistance: Key Levels Every Trader Needs to Know
Welcome, aspiring and veteran financial market participants! Today, we’re talking about one of the most basic, yet powerful, tools in technical analysis: Support and Resistance (S/R) levels. Although they seem like simple concepts, a deep understanding of them is crucial for successfully navigating the (often turbulent) sea of trading.
Think about it: every buy or sell decision in the market is guided by expectations about future price movements. Support and Resistance levels are precisely those points on the chart where history seems inclined to repeat itself, and where the market, in the past, has shown a clear tendency to stop and reverse direction, or to make a significant effort to break through.
Get ready, because we’re going to discover how to identify them, what lies behind their effectiveness, and a surprising phenomenon that doubles their importance: role reversal.
What Are Support and Resistance? A Simple Explanation
Imagine the price of an asset as a bouncing ball.
A Support is like an invisible floor. When the ball (the price) falls and hits this floor, it tends to bounce upwards. It’s a level where buying pressure (the “bulls”) has historically been strong enough to stop or reverse a price decline. Traders expect that when the price approaches this level, there will be an increase in buying, preventing further drops.
A Resistance is like an invisible ceiling. When the ball (the price) rises and hits this ceiling, it tends to bounce downwards. It’s a level where selling pressure (the “bears”) has historically been sufficient to stop or reverse a price increase. Traders expect that once this level is reached, there will be an increase in selling, curbing the advance.
These levels are not exact lines, but rather “areas” or “zones” of price. The market is rarely precise to the penny, so think of them as price ranges where the battle between buyers and sellers intensifies.
How to Identify Support and Resistance on the Chart
Identifying S/R is not an obscure art, but it requires an eye and practice. Here are the most common and effective methods:
- Previous Highs and Lows (Swing Highs/Lows): These are the most obvious and powerful. Points where the price reached a peak and then fell (highs) or touched a bottom and then rose (lows) are excellent candidates for S/R. The more times a level has been touched and held, the stronger it is considered.
- Trendlines: Trendlines are nothing more than dynamic Support and Resistance. An ascending trendline acts as support, while a descending one acts as resistance.
- Moving Averages: Certain moving averages (e.g., 50, 100, 200 periods) can act as dynamic support or resistance, especially on higher timeframes.
- Fibonacci Retracement Levels: Based on mathematical proportions, these levels (38.2%, 50%, 61.8%) often coincide with areas of potential S/R, as the market tends to retrace a percentage of the previous movement.
- Round/Psychological Numbers: Prices like 100, 1,000, 10,000 (or 0.50, 1.00 in Forex) often act as significant S/R because many orders are placed around these psychological values.
- Volume: High volume activity at a certain price level can strengthen the idea that the level is significant, indicating an intense battle between buyers and sellers.
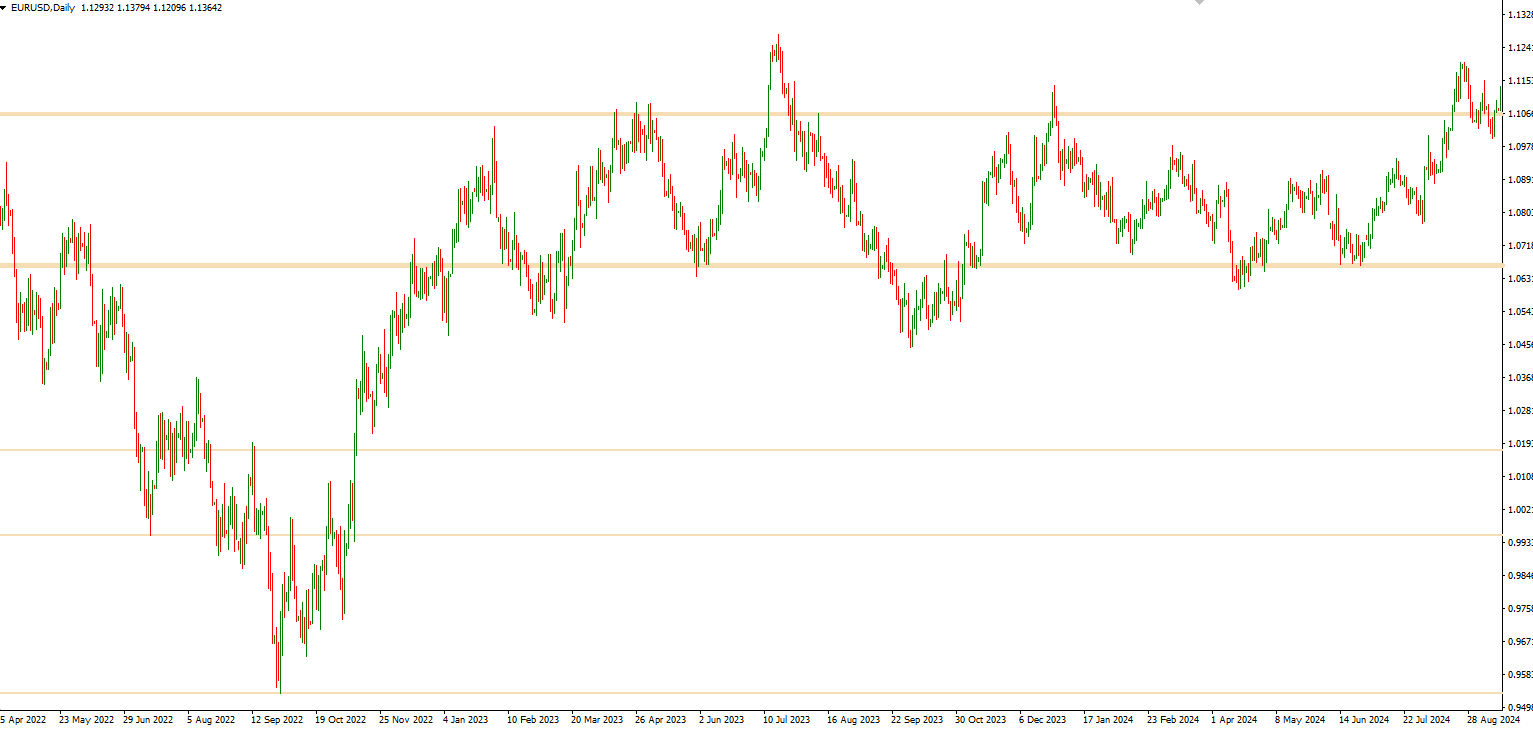 ◎ Esempio di Supporti e Resistenze identificati su un grafico
(Un grafico a candele che mostra linee orizzontali che collegano i massimi e i minimi precedenti, evidenziando le zone di supporto e resistenza.)
◎ Esempio di Supporti e Resistenze identificati su un grafico
(Un grafico a candele che mostra linee orizzontali che collegano i massimi e i minimi precedenti, evidenziando le zone di supporto e resistenza.)
When drawing your lines, look for points where the price has reacted consistently. Don’t worry if the lines aren’t perfect; remember we’re talking about zones.
The Psychology Behind Support and Resistance
Why do these levels work? The answer lies in human psychology and the collective memory of the market.
- Fear and Greed: When the price approaches a previous support, traders who lost money when the price broke a similar level in the past might be tempted to sell (fear of further losses). Conversely, those who profited by buying at that level might want to repeat the operation (greed).
- Reference Points: S/R levels act as visible reference points for thousands, if not millions, of market participants. This leads to a concentration of orders (stop-loss, take-profit, limit orders) precisely around these areas.
- Market Memory: Traders tend to remember where the price encountered difficulties in the past. If a price bounced from 100 three times, the next time it approaches 100, many will be inclined to act, creating a “self-fulfilling prophecy” effect.
In essence, support and resistance are the graphical manifestation of the collective expectations and decisions of millions of traders worldwide.
The Phenomenon of Role Reversal (Polarity Principle)
This is a fundamental concept that elevates the importance of S/R levels. Imagine your invisible floor (support) is finally breached by the ball (the price). What happens? That old floor now becomes a new ceiling.
- When a Support is broken downwards, it transforms into a new Resistance. Traders who bought at that support and are now at a loss might want to sell (or close their positions) once the price returns to that level, precisely to “break even” or with a minimal loss. This creates selling pressure.
- Conversely, when a Resistance is broken upwards, it transforms into a new Support. Traders who sold at that level and are now at a loss might want to buy to cover their positions, and new buyers might see it as a good entry point, expecting the old “ceiling” to now “hold” the price like a floor.
This “polarity reversal” phenomenon is one of the most reliable signals in trading and often offers excellent opportunities to re-enter a trend once a level is retested after the break.
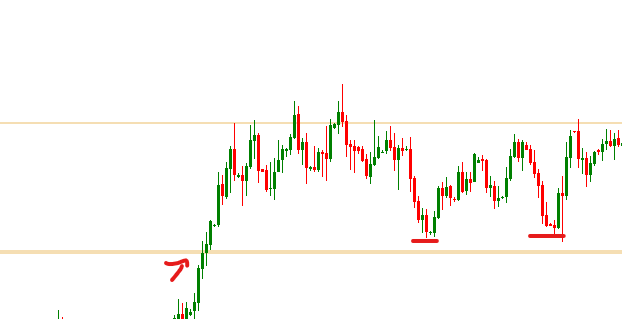 ◎ Illustrazione dell'inversione di ruolo da resistenza a supporto
(Un grafico a candele che mostra una linea di resistenza orizzontale che viene rotta al rialzo dal prezzo, e successivamente, lo stesso livello agisce come supporto quando il prezzo ritraccia su di esso.)
◎ Illustrazione dell'inversione di ruolo da resistenza a supporto
(Un grafico a candele che mostra una linea di resistenza orizzontale che viene rotta al rialzo dal prezzo, e successivamente, lo stesso livello agisce come supporto quando il prezzo ritraccia su di esso.)
Practical Application in Trading
Now that you know how to identify them and understand their psychology, how can you use them?
- Entry Points:
- Buy near a strong support, expecting a bounce.
- Sell near a strong resistance, expecting a pullback.
- Wait for an S/R breakout and then a retest of the now-reversed level to enter in the direction of the new trend.
- Exit Points (Stop Loss and Take Profit):
- Place your stop-loss just below a support (if you are long) or just above a resistance (if you are short). This limits losses if the level doesn’t hold.
- Set profit targets (take-profit) at the next support or resistance level. If you are long from a support, your next target might be the nearest resistance.
- Confirmation: Use S/R in combination with other indicators (e.g., volume indicators, oscillators like RSI or Stochastic) to gain greater confirmation for your decisions. For example, a bounce from support with an increase in volume is a stronger signal.
Conclusion
Support and Resistance levels are the backbone of much of technical analysis. They are not just lines on a chart, but represent zones where the market has made significant decisions in the past and where it is likely to do so again.
Learning to identify them, understanding the psychology that makes them effective, and mastering the concept of role reversal will give you a huge advantage. Remember, trading is a game of probabilities, and knowing where the market is likely to react increases your chances of success.
Start today: open your charts, practice drawing these lines, and observe how the price interacts with them. With practice, they will become one of your most valuable tools. Happy trading!