Hello everyone, market enthusiasts and finance curious! Today we dive into one of the most iconic and feared candlestick patterns by bulls: the Shooting Star, or as we call it in Italian, the Stella Cadente. This particular chart signal is a silent sentinel that warns us when the market, after a wild run, might be about to lose bullish momentum and, potentially, reverse course.
Prepare to discover its meaning, how to recognize it, and why it is so important for anyone wanting to anticipate price movements.
What is the Shooting Star and How to Recognize It?
Imagine a small candlestick with a very small real body, whether it is bullish (green/white) or bearish (red/black). Its most distinctive feature is a very long upper shadow (the “tail” or “wick”), usually at least two or three times the size of the real body, and a lower shadow that is practically absent or very short.
Visually, the Shooting Star resembles a comet with a long tail pointing upwards, hence the name “shooting star”.
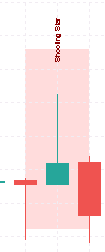 ◎ Anatomia della Shooting Star (Illustrazione di una candela Shooting Star con corpo piccolo, lunga ombra superiore e ombra inferiore quasi assente.)
To be considered a true Shooting Star, and thus a signal of potential bearish reversal, it is crucial that it appears in a consolidated bullish trend. That’s where it gains its full meaning.
The Psychology Behind the Shooting Star
To understand the power of this pattern, we must delve into the market psychology that creates it. Imagine a market that is rising, full of confidence, with buyers (the “bulls”) pushing prices higher and higher.
Opening and Initial Push: The session opens, and the bulls are still in control. They aggressively push the price towards new highs, like a rocket aiming for the sky. This is where the long upper shadow forms: the price rises very high during the trading period.
Sellers’ Intervention: But once those highs are reached, something happens. Sellers (the “bears”) begin to assert themselves, and they do so forcefully. They see those elevated prices as a perfect opportunity to enter the market by selling. The selling pressure is so strong that it manages to push the price significantly back down.
Weak Close: By the end of the session, the price closes near its opening or even below it, forming that small real body and minimal lower shadow. This tells us that, despite a strong bullish attempt, buyers failed to maintain prices high, and sellers regained control, pushing the price downwards.
It’s like a tennis ball forcefully thrown towards the ceiling (the day’s highs), but as soon as it touches it, gravity (selling pressure) pushes it down with equal force, causing it to land near its starting point. This indicates that the “ceiling” (resistance) is stronger than buyers had thought.
Implications for Traders: A Warning Signal
The Shooting Star is a powerful warning signal that bullish sentiment is fading and that sellers are taking control. It is not a guarantee of reversal, but a strong indication that the current trend may not be sustainable.
What to do when you see it?
- Caution: If you are in a long position (you have bought) in a bullish trend, the appearance of a Shooting Star should make your antennae twitch. It might be time to consider reducing your exposure or tightening your stop loss.
- Confirmation: The Shooting Star is a reversal pattern only if confirmed. Confirmation usually comes with a subsequent candle closing below the low of the Shooting Star, or with a significant gap down. Without confirmation, the pattern might fail, and the bullish trend could resume.
- Context: Always consider where the Shooting Star forms. If it appears near key resistance levels, historical highs, or in combination with other technical indicators (such as RSI divergence or high trading volume during the Shooting Star’s formation), its reliability increases significantly.
 ◎ Shooting Star in azione su un grafico dei prezzi (Grafico a candele che mostra un trend rialzista, seguito da una candela Shooting Star e una successiva diminuzione del prezzo, indicando un’inversione.)
Do Not Confuse with the Inverted Hammer!
It’s easy to confuse the Shooting Star with the Inverted Hammer, as they have a similar shape. The crucial difference lies in the context:
- Shooting Star: Appears in a bullish trend and signals a potential bearish reversal.
- Inverted Hammer: Appears in a bearish trend and signals a potential bullish reversal.
Remember: location is everything!
Conclusion
The Shooting Star is a valuable tool in every technical analyst’s arsenal. It teaches us that price is not just a number, but the result of a continuous battle between buyers and sellers. When a Shooting Star appears in a bullish trend, it is telling us that sellers have struck a powerful blow and interrupted the buyers’ dominance, signaling that the market may indeed lose its bullish momentum.
Never act impulsively based on a single signal, but use it as a warning bell to deepen your analysis and prepare for a potential change in direction. The ability to read these silent signals will give you a significant advantage in understanding market dynamics.
Happy trading, and may the (shooting) stars always be in your favor for accurate analysis!