Bear Pennant: A Bearish Continuation Signal
Hello everyone, market enthusiasts and aspiring traders! Today, we’re diving into the world of technical analysis to discover a fascinating and often very effective chart pattern: the Bear Pennant. If you’ve ever wondered how professionals identify trend continuation signals, you’re in the right place. This pattern, when interpreted correctly, can provide valuable insights into the future direction of an asset.
Introduction: What are continuation patterns?
In trading, markets rarely move in a straight line. Often, after a decisive move (whether upwards or downwards), prices tend to “catch their breath,” consolidating within a tighter range before resuming their original direction. These periods of pause are represented by specific chart patterns, known as continuation patterns. The Bear Pennant is one such pattern, indicating that a bearish trend is highly likely to continue.
What is the Bear Pennant?
Imagine the price of a stock plummeting rapidly, like a ball falling down a steep hill. At some point, the ball slows down, bouncing slightly between two increasingly narrowing boundaries, until it forms a small triangle. Then, suddenly, the ball resumes its downward journey with the same intensity as before. In essence, that’s the Bear Pennant.
It is a bearish continuation pattern that forms during an established downtrend. It is distinguished by its small, symmetrical triangle-shaped consolidation, which makes it resemble a “small flag” with a point.
How is the Bear Pennant formed?
To understand how a Bear Pennant is formed, let’s break it down into its main components:
The Pole: This is the initial and most obvious part of the pattern. It represents a strong and rapid downward price movement. It’s like the “pole” of a flag. This movement is often accompanied by high volumes, indicating strong selling pressure.
The Consolidation (Pennant): After the sharp decline, the price enters a consolidation phase. Here, buyers and sellers are in a temporary equilibrium, and the price moves within an increasingly narrow range. Graphically, this translates into a small symmetrical triangle, where the upper (resistance) and lower (support) trendlines converge. During this phase, trading volume tends to decrease dramatically, a sign of market indecision.
The Breakout: This is the most critical phase. The price decisively breaks below the lower trendline of the triangle. This “breakout” is the signal that the consolidation has ended and that the pre-existing bearish trend is about to resume. A valid breakout is almost always accompanied by a significant increase in volume, confirming renewed selling pressure.
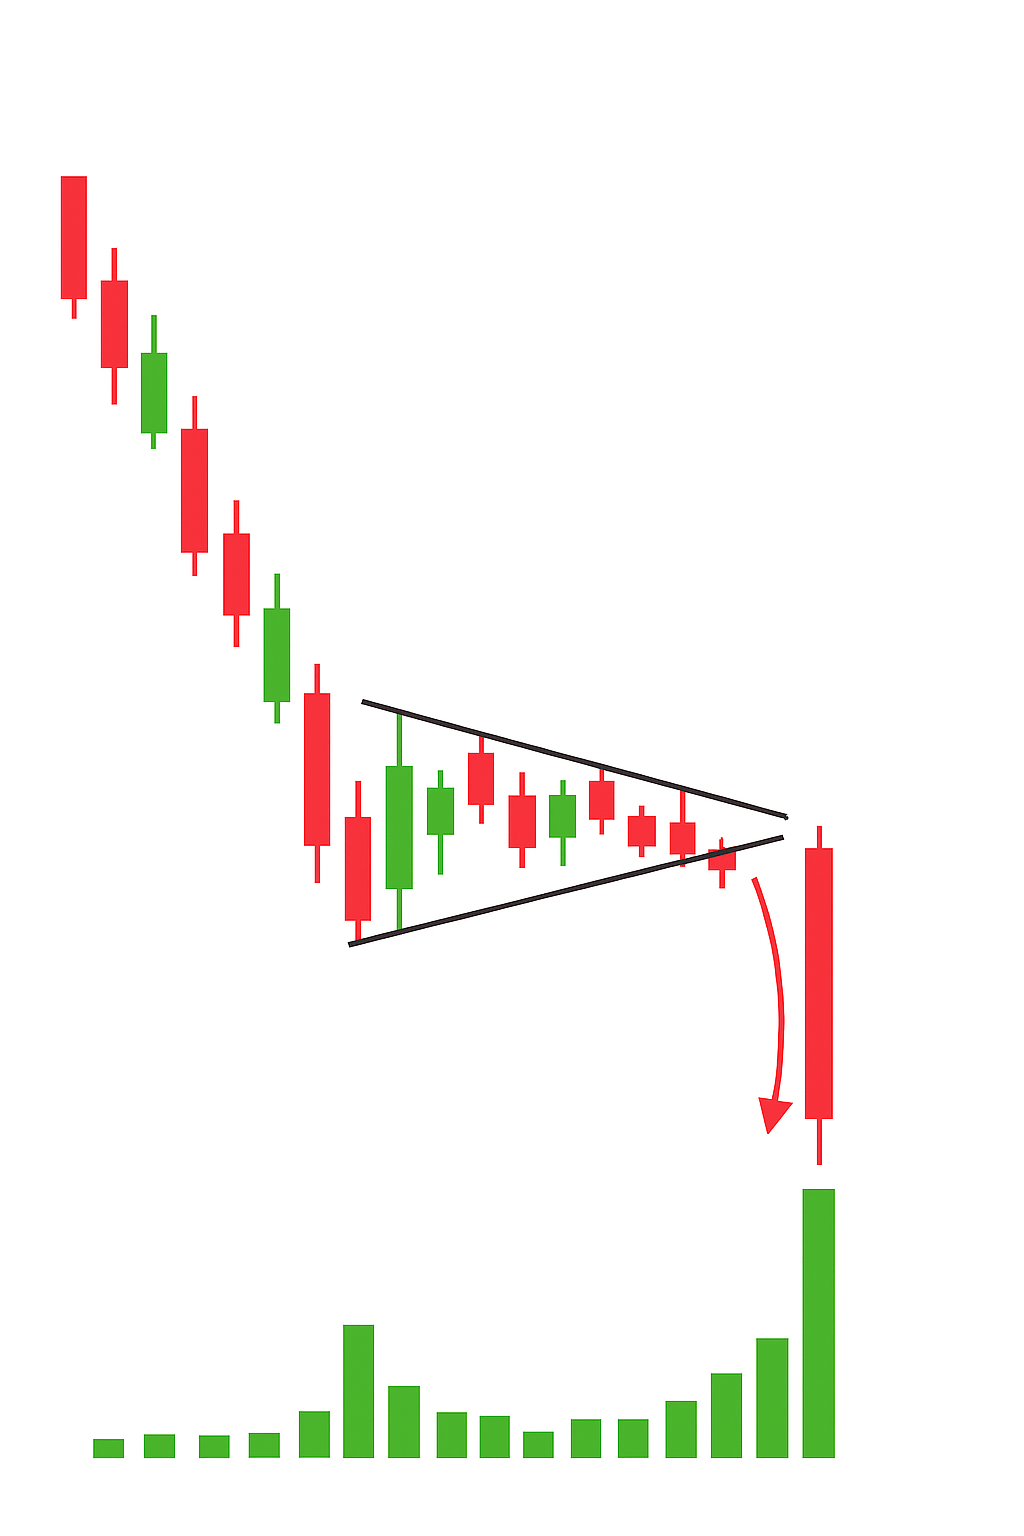 ◎ Structure of the Bear Pennant: Pole, Consolidation, and Breakout (Image showing a bear pennant, including the initial strong downtrend phase (the pole), the symmetrical triangle-shaped consolidation (the pennant), and the downward breakout, with indications for decreasing volume in the pennant and increasing volume at breakout.)
How to identify and trade the Bear Pennant
Recognizing and trading a Bear Pennant requires attention and patience. Here are the key steps:
Phase 1: Identify the Pre-existing Trend: Ensure there is a clear and decisive downtrend in place before the pattern forms. Without an established trend, there cannot be a continuation pattern.
Phase 2: Recognize the Triangular Consolidation: Look for a small symmetrical triangle formed by converging trendlines. It is crucial that the consolidation is relatively short compared to the pole and that the price moves within this triangle.
Phase 3: Monitor Volume: Volume is our silent “confirmer.” It should be high during the formation of the pole, decrease during the pennant consolidation, and increase dramatically at the time of the downward breakout. If the volume does not behave this way, the pattern’s validity is questionable.
Phase 4: Wait for the Breakout: Don’t rush! Wait for the price to break convincingly below the lower trendline of the pennant. A candlestick close (or more) below this line is a stronger signal than just a “shadow” touching it.
Price Target: Once the breakout is confirmed, how do we calculate the potential future movement? A common technique is to measure the height of the “pole” (the initial movement from the highest point to the beginning of the consolidation) and project this distance from the pennant’s breakout point. This projection provides an approximate price target for the bearish move.
Stop Loss: Risk management is crucial. Place your stop loss just above the upper trendline of the pennant (or slightly above the highest point of the consolidation). This will protect you in case the pattern fails and the price unexpectedly reverses.
 ◎ How to calculate target and stop loss with the Bear Pennant (Chart showing a bear pennant with the projection of the “pole” for the price target and a stop loss level positioned just above the triangular consolidation for risk management.)
Bear Pennant vs. Bear Flag: What’s the difference?
Often the Bear Pennant is confused with the Bear Flag. While both are bearish continuation patterns with an initial “pole” and a consolidation phase, the key difference lies in the shape of the consolidation:
- Bear Pennant: The consolidation is a symmetrical triangle (converging trendlines).
- Bear Flag: The consolidation is a rectangle or parallel channel that slopes slightly against the trend (for example, an ascending channel in a downtrend).
Both suggest a bearish continuation, but the geometric shape of the consolidation is what visually distinguishes them.
Practical Tips for Traders
- Do Not Trade in Isolation: The Bear Pennant is a great tool, but it’s not a magic wand. Always use it in combination with other indicators (e.g., RSI, Moving Averages) or analyses (e.g., support and resistance) for stronger confirmation.
- Patience is a Virtue: Always wait for breakout confirmation and an increase in volume before entering a position. False breakouts can be costly.
- Risk Management: Learn to correctly calculate your stop loss and accept that not all patterns will work as expected. Risk is an integral part of trading.
- Timeframe: Bear Pennants can form on any timeframe (from 1-minute candles to weekly charts). Reliability tends to increase on higher timeframes.
Conclusion: A Powerful Signal, but with Caution
The Bear Pennant is a powerful and relatively reliable continuation chart pattern, capable of signaling the resumption of a downtrend. Understanding its formation, knowing how to identify it, and, above all, applying proper risk management, can make a difference in your trading journey. Remember, technical analysis is an art and a science that is honed through continuous practice and study. Keep learning and exploring the markets!