Long-Legged Doji: When Uncertainty is Extreme
Imagine being in the middle of a battle, but not just any battle: one where both factions, buyers (bulls) and sellers (bears), confront each other with extreme force, pushing the price up and down violently, but by the end of the day the front finds itself exactly, or almost, at the same starting point. This is, in essence, what a Long-Legged Doji tells us about financial markets.
In the world of technical analysis, Japanese candlesticks are open windows into market psychology. Each candle encloses a story of open, high, low, and close within a specific period. Among these, Doji candles are particularly fascinating because they signal indecision. But the Long-Legged Doji takes this indecision to an extreme level.
What is a Doji Candle? A Quick Recap
Before diving into the “Long-Legged”, let’s have a quick recap. A Doji candle forms when an asset’s open and close prices are very close to each other, or even identical. This means that, despite price movements during the period, the market returned to its starting point, indicating a balance between supply and demand. The candle’s “body” is therefore extremely small or non-existent.
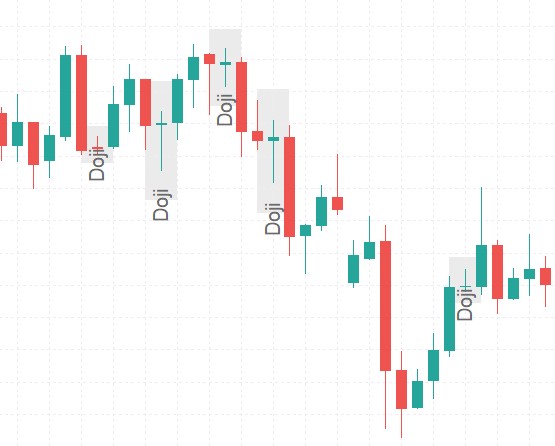 ◎ Anatomia di una Candela Doji standard (Un grafico che mostra una singola candela Doji con un corpo molto piccolo e ombre superiori e inferiori di media lunghezza.)
The Anatomy of Uncertainty: The Long-Legged Doji
Now, imagine that small Doji candle, but with its “legs” (the shadows) extending enormously both upwards and downwards. This is the Long-Legged Doji.
This candle is characterized by:
- Very Small or Non-Existent Real Body: Like any Doji, the open and close are almost identical.
- Extremely Long Upper Shadows: Indicates that during the period prices were pushed significantly higher than the open/close. Bulls attempted a strong advance.
- Extremely Long Lower Shadows: Symmetrically, it indicates that prices were pushed significantly lower than the open/close. Bears attempted a strong decline.
In practice, the Long-Legged Doji forms when the price moves extremely volatilely during the period (an hour, a day, a week), but at the end of the session it closes back near the opening point. It’s as if the market took a turbulent journey, but ended up exactly where it started.
What the Long-Legged Doji Tells Us
The presence of a Long-Legged Doji on a chart is a powerful and visual signal of extreme indecision and volatility. Here are its main implications:
- Precarious Balance: It indicates that both buyers and sellers have been very active and aggressive, but neither has managed to prevail significantly. The market is in a state of “stalemate”.
- Potential Trend Reversal: If a Long-Legged Doji appears after a long and strong bullish trend, it may suggest that buyers are losing momentum and that selling pressure is increasing, signaling a potential downward reversal. Conversely, after a strong bearish trend, it may indicate that sellers are exhausted and that buying pressure is growing, suggesting a potential upward reversal.
- Increased Volatility: The long shadows are tangible proof of wide price movements within the period, implying increased volatility and, consequently, uncertainty.
- Reflection or Consolidation: Sometimes, this candle can appear in a context of market consolidation or reflection, where participants are “digesting” previous movements and deciding their next move.
How to Interpret and Use the Long-Legged Doji in Trading
It is crucial to remember that no single candlestick pattern should be used in isolation to make trading decisions. The Long-Legged Doji is a warning signal, not a verdict.
Context is Key: Its importance is amplified if it appears at key points on the chart, such as near significant support or resistance levels, or after a prolonged and strong price movement.
- If it appears after a strong rise: It is an alarm bell indicating that the bulls may have lost control.
- If it appears after a strong decline: It is an alarm bell indicating that the bears may have lost control.
Wait for Confirmation: The Long-Legged Doji alone is not a reversal signal. Confirmation from subsequent candles is needed.
- After a rise: If the next candle closes below the low of the Long-Legged Doji, or forms another bearish candle, the reversal could be confirmed.
- After a decline: If the next candle closes above the high of the Long-Legged Doji, or forms another bullish candle, the reversal could be confirmed.
Volume: High volume during the formation of the Long-Legged Doji can strengthen the signal, indicating greater market participation in this intense battle of indecision.
Risk Management: Given the high volatility this candle implies, risk management is crucial. Setting appropriate stop-loss orders is essential to protect capital.
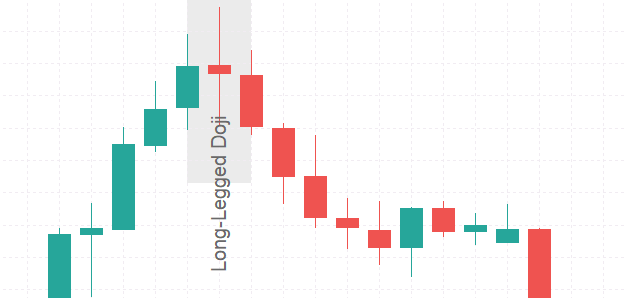 ◎ Long-Legged Doji in un contesto di inversione (Un grafico a candele che mostra un trend rialzista seguito da una Long-Legged Doji al vertice, e poi un’inversione al ribasso. Un secondo esempio mostra un trend ribassista, una Long-Legged Doji al minimo, e un’inversione al rialzo.)
Conclusion: A Warning Signal, Not a Panic Button
The Long-Legged Doji is a fascinating pattern because it captures a moment of intense struggle and indecision in the market. It is not a trading signal to be blindly followed, but rather a powerful reminder that the market is at a turning point or in a phase of reflection. When you see it on your charts, remember that uncertainty is extreme and that it’s time to be alert, analyze the context, and wait for the market to show its next move. Patience, as always, is the trader’s virtue.