Hello to all financial market enthusiasts and anyone looking to decipher the hidden signals in charts! Today, we shed light on a Japanese candlestick pattern that, when spotted in the right context, can act as a true “warning bell” for an imminent change of direction: the Hanging Man, or in Italian, the Impiccato (The Hanged Man).
If you’re used to seeing prices rise, rise, and keep rising, one day you might encounter this pattern. Despite its somewhat grim name, recognizing it can make the difference between riding a wave of profit and getting trapped in a correction.
What is the Hanging Man?
Imagine a stylized little man, hanging. This is the shape we expect to see. The Hanging Man is a single candlestick pattern with very specific characteristics:
- Small Real Body: The central part of the candle (the body) is very small and located at the upper end of the day’s trading range. This body can be either green (bullish) or red (bearish), but its color is of secondary importance compared to its position and shadows.
- Long Lower Shadow: There is a very long shadow (or “tail”) extending downwards, at least two or three times the length of the real body.
- Absent or Very Small Upper Shadow: The upper shadow is practically non-existent or very, very small.
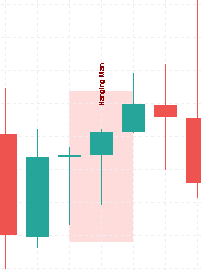 ◎ Struttura del Candlestick Hanging Man (Illustration of the Hanging Man candlestick shape: small body at the top, long lower shadow, no upper shadow or very small.)
The Hidden Meaning Behind the Hanging Man
Now, why is this pattern a “warning bell”? To understand this, we need to delve into the psychology behind its formation, especially when it appears in a consolidated uptrend.
Let’s consider an uptrend. Buyers are in full control, pushing prices higher and higher. When the Hanging Man appears, something interesting happens during the trading day:
- Strong Open, Then Downward Attempt: Prices open (or continue to rise), but at some point, sellers make their presence felt strongly, pushing the price significantly downwards.
- Buyers’ Reaction (The Last Breath?): Buyers try to react, pushing the price back up and managing to close the day near the open or the daily high.
- The Warning Signal: That long lower shadow is the key. It shows that, even though buyers managed to regain some ground, there was significant selling pressure that caused the price to drop heavily during the session. It’s as if the market made a downward attempt that was ‘rejected’, but that attempt revealed a latent weakness among buyers. They expended a lot of energy to keep the price up, but sellers flexed their muscles.
In an uptrend, this pattern suggests that buyer strength might be at its limit. Prices were pushed down significantly, and even if they recovered, the effort required from buyers was substantial. It’s a sign that the ground beneath buyers’ feet is thinning.
When and Where to Look for the Hanging Man?
The key to the Hanging Man is context. This pattern is significant only if it appears at the peak of a consolidated uptrend. If you see it in a sideways or downtrend, its meaning is much less relevant and it might not even be considered a valid Hanging Man.
Imagine the price of a stock consistently rising for weeks, drawing higher highs and higher lows. Then, one day, this ‘Hanging Man’ shaped candle appears. This is the time to pay close attention!
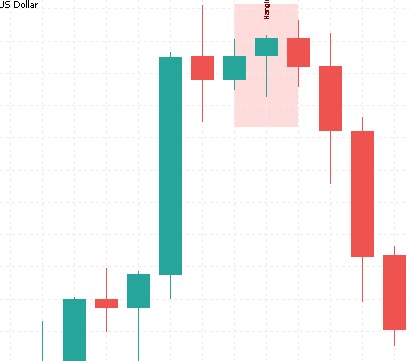 ◎ Hanging Man come segnale di inversione in un trend rialzista (Chart of an asset with an uptrend, followed by the appearance of a Hanging Man candlestick and subsequent bearish reversal.)
How to Confirm the Signal?
The Hanging Man is a “warning bell”, not a guarantee. To turn it into an actionable signal, it’s crucial to await confirmation. What to look for?
- Next Day’s Close: The most important confirmation comes on the following day (or session). If the price opens and closes below the Hanging Man’s real body, or even below its lower shadow, the bearish reversal signal is much stronger. A close below the Hanging Man’s low is a powerful bearish signal.
- Volume: A significant increase in volume during the formation of the Hanging Man and, especially, in the bearish confirmation candle, further strengthens the signal. High volume indicates that many market participants are acting.
- Other Indicators: Use the Hanging Man in combination with other technical analysis tools. For example, if the Hanging Man appears near a significant resistance level, or if indicators like the RSI show a bearish divergence or are in an overbought zone, the signal becomes even more credible.
Conclusion: Act with Caution and Intelligence
The Hanging Man is a powerful candlestick pattern, but like all technical analysis tools, it is not infallible. It is a warning signal, an indication that the bullish momentum might be exhausted and that sellers are starting to take control.
Recognizing it in a consolidated uptrend and awaiting its confirmation can help traders to:
- Protect profits: If you are long on an asset, it might be time to consider closing or reducing your position.
- Prepare for short positions: For more aggressive traders, a confirmation of the Hanging Man might indicate an opportunity to enter a short position (short selling), anticipating a price decline.
Always remember: technical analysis is both an art and a science. No single signal should be interpreted in isolation. The Hanging Man is an arrow in your arsenal, a valuable indicator that, when used wisely and in combination with other analyses, can significantly improve your trading decisions.
Now that you know how to recognize the Hanging Man, the next time you see it in an uptrend, you’ll know it might be time to pay attention and prepare for a change in wind!
Happy trading!