Hammer: A Signal of Buying Strength After a Decline
Imagine being in a difficult market moment, with prices continuing to fall, bringing with them a sense of discouragement. You feel as if the market is a ship adrift in a storm. But what if, all of a sudden, a lighthouse appeared in the fog, pointing the way to a safe harbor? In the world of technical analysis, this “lighthouse” could be the Hammer pattern.
This Japanese candlestick pattern is one of the most studied and beloved figures by traders, not for its aesthetic beauty, but for its profound meaning: a potential bullish reversal signal, a clear sign that buying strength is powerfully returning after a period of decline.
If you’re curious to understand how a simple “hammer” can cut through the clouds of a downtrend and signal the beginning of a recovery, you’re in the right place. Let’s find out together!
What is the Hammer Pattern?
The Hammer is a single candlestick, easy to recognize by its distinctive shape. To visualize it, think of a carpenter’s hammer: a compact head (the candle’s body) and a long handle (the long lower shadow).
Here are its main characteristics:
- Small body: The real body of the candle (the difference between the opening and closing price) is very small. It can be bullish (green/white) or bearish (red/black), although a bullish body is generally considered a stronger signal.
- Long lower shadow: This is the most distinctive characteristic. The lower shadow (or “wick”) must be at least two or three times the size of the real body. This indicates that, after initial selling pressure, buyers intervened strongly, pushing prices significantly higher before the close.
- Little to no upper shadow: The presence of a very short or absent upper shadow suggests that the closing price is near or even equal to the session’s high, reinforcing the idea that buyers dominated the end of the session.
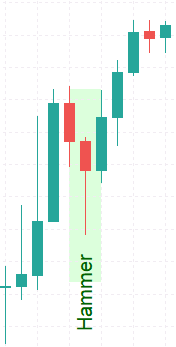 ◎ Struttura del Pattern Candlestick Hammer (Illustrazione della forma di una candela Hammer, mostrando il corpo piccolo e la lunga ombra inferiore.)
The Psychology Behind the Hammer: A Battle Won by Buyers
The beauty of Japanese candlestick patterns lies in their ability to tell a story, to show the “market psychology” during a given period. The Hammer is no exception.
Imagine the market as a battlefield between buyers (bulls) and sellers (bears). After a long and painful downtrend, the bears seem to be in control. At the beginning of the Hammer candle’s session, sellers continue to push prices lower, creating new lows. It’s a moment of widespread pessimism.
However, just when it seems the fall will never end, something changes. At these very low prices, institutional and retail buyers see an irresistible opportunity. They begin to intervene strongly, absorbing all the selling pressure and pushing the price aggressively upwards. By the end of the session, the price has not only recovered initial losses but has closed near or even above the opening price.
This is the “hammer” in action: a decisive “hammering” on the low prices, a categorical rejection of further declines by buyers, who regain control and show clear strength. It’s as if the market has hit a temporary bottom and is now about to rebound.
When and Where to Find It: Context is King!
An isolated Hammer, without context, is like a white flag waved randomly: it means little. The effectiveness of the Hammer pattern is strictly linked to its positioning.
The Hammer is a bullish reversal pattern, which means it is significant only when it appears after a clear downtrend. If you see it in an uptrend, it might be a “Hanging Man”, which has the opposite meaning, or in a sideways market, where its meaning is weak.
Look for the Hammer when:
- There has been a clear and prolonged downward price movement.
- The price approaches a significant support level, such as a previous low, an important moving average, or a trend line. The combination of a Hammer at support is a very powerful signal.
How to Interpret the Signal (and its Confirmations)
Finding a Hammer is the first step, but it’s not enough to open a position. Technical analysis is not an exact science, and every signal requires confirmation.
The Signal
A Hammer suggests that selling pressure has exhausted and buying pressure is regaining control. The longer the lower shadow and the smaller the body, the stronger the signal, as it indicates a more aggressive rejection of lower prices.
The Confirmation
This is the crucial step. Confirmation occurs when the candle following the Hammer closes above the Hammer’s body and, ideally, above the Hammer’s closing price. This indicates that buying strength is continuing to push prices higher, validating the reversal signal.
Additional Confirmation Elements:
- Volume: An increase in volume on the Hammer candle or the confirmation candle is a very positive signal. It indicates that a large number of participants are engaging in this reversal, confirming the strength of the move.
- Bullish Confirmation Candle: A robust and bullish subsequent candle (a “bullish follow-through”) that closes decisively above the Hammer’s highs is the clearest indication that the reversal is underway.
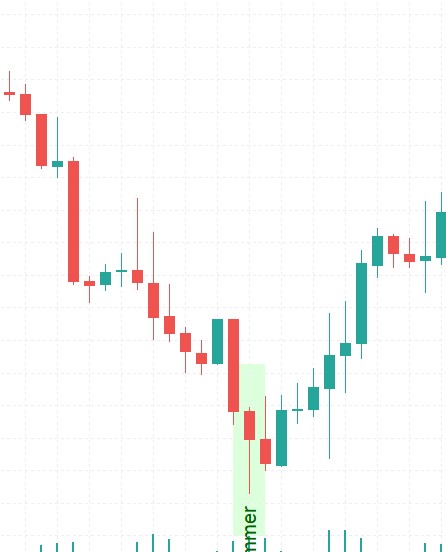 ◎ Pattern Hammer in un Trend Discendente e Inversione Rialzista (Grafico di un asset finanziario che mostra un trend discendente seguito dall’apparizione di un pattern Hammer e la successiva inversione rialzista confermata.)
Practical Examples and Trading Tips
Let’s put what we’ve learned into practice:
- Identify the Context: Before looking for the Hammer, ensure that your asset is in a clear downtrend. Don’t look for reversal signals where they’re not needed!
- Find the Hammer: Carefully observe the candlesticks. Remember the characteristics: small body, long lower shadow, little to no upper shadow.
- Await Confirmation: This is the most important phase to reduce false signals. Do not act solely on the formation of the Hammer. Wait for the subsequent candle to close bullishly, preferably above the Hammer’s body, and observe the volume.
- Risk Management: If you decide to enter a position, a good place to set your stop loss (the point at which you will exit the trade to limit losses) is just below the low of the Hammer candle. This way, if the reversal does not materialize and the price drops below the Hammer’s low, you will know that the signal has been invalidated and you can exit with a contained loss.
- Profit Target: Your profit targets can be identified using previous resistance levels, moving averages, or other technical analysis tools.
- Combine with Other Tools: The Hammer is powerful, but its effectiveness increases exponentially when combined with other indicators. For example, a Hammer that appears while the RSI (Relative Strength Index) is in the “oversold” zone adds an additional layer of confirmation to the signal.
Conclusion: The Hammer, A Valuable Ally
The Hammer pattern is a powerful reminder that, even in the most bearish markets, hope and buying strength can re-emerge. It is not a guarantee of success (no pattern is!), but it is a valuable tool in your technical analysis arsenal. Learning to identify it correctly and, especially, to interpret it in the right context and with due confirmation, can provide you with a significant advantage in your trading decisions.
Always remember that technical analysis is an art and a science that requires practice and careful risk management. Keep studying, observing charts, and honing your skills. The Hammer is just the beginning of a fascinating journey into the world of financial markets.
Happy trading!