The Japanese Candlestick Chart: Anatomy of a Candlestick (Body, Shadows, Open, Close, High, Low)
Welcome, financial market enthusiasts! If you’re here, you’ve probably already encountered “Japanese candlestick charts,” one of the most powerful and intuitive tools available to every trader and analyst. Unlike simpler line charts, candlesticks don’t just show the closing price; they tell a true “story” of price action within a given period.
Understanding each single element of a candlestick is the fundamental first step to deciphering market sentiment and making informed decisions. Ready to unveil the secrets contained within these small but significant figures? Let’s begin!
What is a Japanese Candlestick? A Story in an Instant
Imagine a single candlestick as a small visual summary of what happened to a price within a specific timeframe: one minute, one hour, one day, one week, etc. Each candlestick condenses four key pieces of information into an easily digestible format.
These four pieces of information are:
- Opening Price (Open): The price at which the asset began trading in the considered period.
- Closing Price (Close): The price at which the asset finished trading in the considered period. This is often the most important price, as it reflects the final agreement between buyers and sellers for that period.
- Highest Price (High): The highest price reached by the asset during the period.
- Lowest Price (Low): The lowest price reached by the asset during the period.
Now, let’s see how this information translates visually into the structure of a candlestick.
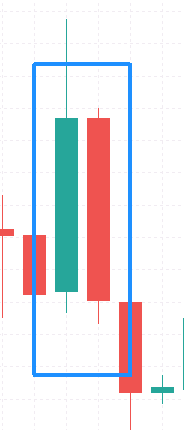 ◎ Anatomia di una Candela Giapponese: Componenti (Immagine che mostra una candela bullish e una bearish con Open, Close, High, Low, Corpo e Ombre etichettate)
The Fundamental Components of a Candlestick
Each candlestick is composed of two main elements: the Body and the Shadows (often also called “wicks” or “shadows”).
1. The Candlestick Body (Real Body)
The body is the thickest, central part of the candlestick and immediately tells us whether the price rose or fell during the considered period. Its color (or shade) is crucial.
Bullish Body (Green or White): The Buyers’ Strength
- If the closing price is higher than the opening price, the candlestick is considered bullish (upward-trending).
- The body will typically be colored green or, in more traditional charts, left white/hollow.
- A long bullish body indicates strong buying pressure, suggesting that buyers clearly dominated sellers, pushing the price significantly higher from open to close. It’s like a boxer winning by technical KO, demonstrating their superiority in that round.
- A short bullish body indicates that buyers had a slight advantage, but without overwhelming force.
Bearish Body (Red or Black): The Sellers’ Pressure
- If the closing price is lower than the opening price, the candlestick is considered bearish (downward-trending).
- The body will typically be colored red or, in more traditional charts, black/filled.
- A long bearish body indicates strong selling pressure, suggesting that sellers overwhelmed buyers, driving the price down significantly from open to close. Here, the seller dominates, pushing the price to lower levels.
- A short bearish body indicates that sellers had a slight advantage, but the pressure was not excessive.
In summary regarding the Body: The longer the body (whether bullish or bearish), the greater the strength and conviction with which buyers or sellers controlled the market during that period. A very short or almost non-existent body (like in Doji, which we’ll see in future articles!) indicates indecision, a momentary “stalemate” between the forces at play.
2. The Shadows (Wicks/Shadows): Attempts and Resistances
The shadows, or “wicks” or “shadows,” are the thin lines that extend from the top and bottom of the candlestick body. They represent the highest and lowest prices reached during the period, even if the price failed to maintain that position there. They are like the market’s “attempts” to push further, and the “rejections” of those levels.
Upper Shadow: The Attempted and Rejected High
- It extends from the highest price of the body (whether it’s the open or close, depending on whether the candlestick is bullish or bearish) up to the Highest Price (High) reached.
- A long upper shadow indicates that buyers pushed the price significantly higher, but failed to maintain it there, and sellers intervened to bring the price back down before the close. This is like an athlete attempting to break a record, touching it, but failing to stabilize at that level and having to retreat. It can suggest potential resistance at that price level.
Lower Shadow: The Found and Rejected Low
- It extends from the lowest price of the body down to the Lowest Price (Low) reached.
- A long lower shadow indicates that sellers pushed the price significantly lower, but failed to maintain it there, and buyers intervened to bring the price back up before the close. Here, it’s as if the price “found the bottom” and was strongly rejected upwards. It can suggest potential support at that price level.
In summary regarding the Shadows: Shadows show us the volatility and the “battles” that took place at the edges of the price range. Long shadows often indicate indecision or a strong rejection of a certain price level, while short shadows suggest that most of the price action occurred within the body’s range, with fewer extreme explorations.
Let’s Recap: The Four Key Prices Within a Candlestick
To leave nothing to chance, let’s review the four key prices that define a candlestick:
- Open: This is the starting point of the candlestick, the first price traded in the period. If the body is bullish, the open is the bottom edge of the body. If the body is bearish, the open is the top edge of the body.
- Close: This is the ending point of the candlestick, the last price traded in the period. It is often considered the most significant price because it reflects the market’s “final decision” for that period. If the body is bullish, the close is the top edge of the body. If the body is bearish, the close is the bottom edge of the body.
- High: The tip of the upper shadow. It represents the highest price touched during the period, even if only for an instant.
- Low: The tip of the lower shadow. It represents the lowest price touched during the period, even if only for an instant.
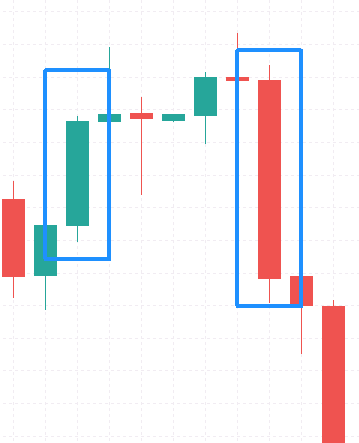 ◎ Significato delle Candele: Forza dei Compratori e Venditori (Illustrazione che mostra una candela bullish con corpo grande e ombre piccole, e una candela bearish con corpo grande e ombre piccole, con brevi descrizioni del loro significato implicito)
The Importance of Understanding the Anatomy
Why is it so important to thoroughly understand the anatomy of a single candlestick?
- Market Sentiment: The length of the body and shadows, and their ratio, offer an immediate reading of the predominant sentiment (who is in control: buyers or sellers?) and the intensity of that battle.
- Volatility: Long shadows signal greater volatility, indicating that the price moved significantly back and forth, while short shadows indicate calmer, less scattered trading.
- Support and Resistance Levels: Shadows can indicate where the price found support (long lower shadows: the price dropped but was “rejected” upward) or resistance (long upper shadows: the price rose but was “rejected” downward), even if it failed to close at those levels. These levels are often observed by traders for future entry or exit points.
- Basis for Patterns: Understanding these components is the foundation for then recognizing complex and powerful candlestick patterns (such as Engulfing, Doji, Hammer, etc.), which can predict trend reversals or continuations.
Conclusion
Japanese candlesticks are much more than simple bars on your charts; they are the visual language of the market. Each candlestick tells a micro-story of the struggle between supply and demand, buyers and sellers, bulls and bears. By learning to read these stories, you unlock a level of market understanding that simple line charts cannot offer.
This is just the beginning of your journey into the fascinating world of Japanese candlesticks. In the next article, we will explore how different candlesticks combine to form patterns that provide us with even clearer signals about future price movements.
Happy trading and happy analyzing!