Hello and welcome to the blog! Today we’re diving into one of the most fascinating and powerful chart patterns in technical analysis: the Double Bottom. Imagine a boxer about to hit the canvas, but twice he gets back up, showing incredible resilience. This is, in simple terms, the message the Double Bottom wants to send us: the price has found such strong support that it cannot fall further, suggesting a potential trend reversal.
If you are passionate about financial markets, a novice trader, or simply curious about how to “read” charts, this article is for you. Let’s discover together how to recognize this pattern and what signals it offers us.
What is the Double Bottom? A Rocky Foundation
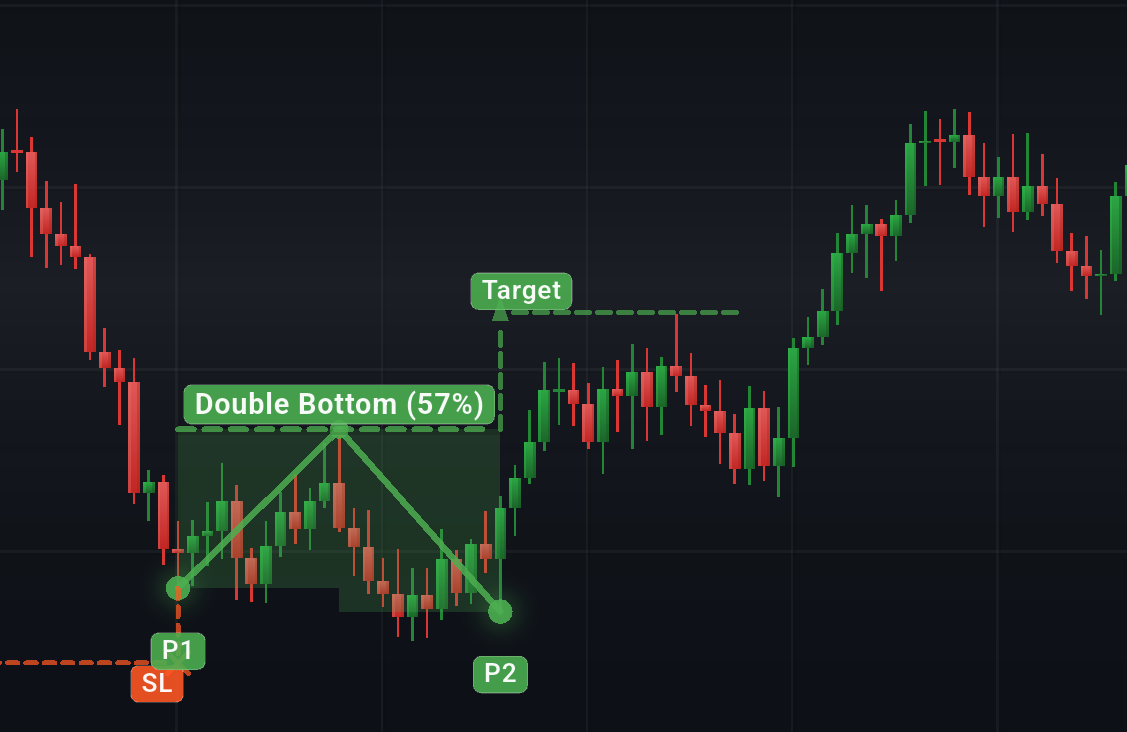
The Double Bottom is a bullish reversal pattern that forms at the end of a downtrend. Its appearance resembles a “W” and, as the name suggests, it is characterized by two distinct bottoms that form approximately at the same price level. These bottoms indicate that the price has tested a significant support level twice, failing each time to fall further.
Think of it as a very robust floor: the price, pushed by sellers, tries to break through it, but twice in a row, it bounces, indicating that the bearish pressure is losing strength and that buyers are starting to take control.
How Does the Double Bottom Form? Market Dance Steps
The formation of the Double Bottom follows a precise sequence:
- First Bottom: The price, in a downtrend, reaches a new low and then bounces slightly. This is the buyers’ first attempt to halt the decline.
- Peak: After the first bottom, the price rises, forming a temporary peak. This is the highest point reached before the subsequent decline. This peak is crucial and is defined as the pattern’s “Neckline”.
- Second Bottom: The price falls again, attempting to break the support of the first bottom, but fails. It re-tests the same price level (or a very similar one, with a tolerance of a few percentage points) as the first bottom and bounces again. This second failure to overcome support is a sign of buyers’ strength.
- Neckline Breakout: The most important phase! The price, after forming the second bottom, starts to rise decisively and breaks above the “Neckline” (the peak formed between the two bottoms). This breakout, often accompanied by a significant increase in volumes, is the real confirmation that the trend is about to reverse.
 ◎ Il pattern del Doppio Minimo: due minimi, la neckline e il breakout (Un grafico a candele che mostra un trend discendente, la formazione di due minimi simili allo stesso livello di prezzo, una neckline tra di essi e un breakout rialzista sopra la neckline, seguito da un movimento al rialzo.)
The Three Pillars of the Double Bottom: What to Look For
To have a reliable Double Bottom pattern, there are some elements to observe:
- The Two Bottoms: They must be well distinct and at the same price level or very close. A small difference is normal, but if the second bottom is significantly lower than the first, we might not be looking at a Double Bottom.
- The Neckline: It is the most important resistance level for the pattern. Its breakout is the key signal.
- Volume: This is the “fire test.” Ideally, volumes should be low or decreasing during the formation of the second bottom (indicating that sellers are exhausting themselves) and then increase drastically at the time of the neckline breakout. A breakout without significant volumes can be a false signal.
 ◎ Doppio Minimo: L'importanza del volume nella conferma del pattern (Un grafico che mostra il pattern del Doppio Minimo affiancato da un indicatore di volume. Il volume è basso sui minimi e aumenta significativamente al momento del breakout della neckline, indicando una conferma rialzista.)
Trading with the Double Bottom: Strategies and Tips
Once a Double Bottom is identified, how can we use it to our advantage in trading?
- Entry Point: The most common and safest entry is after the price has clearly broken and closed above the neckline. Some more aggressive traders might consider entering on a pullback to the neckline after the breakout (the neckline, once broken, often turns into support).
- Stop Loss: To protect your capital, place the stop loss below the second bottom. This point represents the invalidation of the pattern: if the price falls below it, the Double Bottom has failed.
- Target Price: A common way to calculate a price target is to measure the vertical distance from the lowest point of the two bottoms up to the neckline. Then project this same distance upwards, starting from the breakout point of the neckline. This will give you an indication of the potential upward movement.
A Practical Example: Let’s See the Double Bottom in Action
Imagine a company whose stock price is constantly falling due to negative news. The price drops to €10, finds initial support, and rises to €12. Then, driven by further selling, it returns to €10, but once again bounces, confirming that there is strong demand at €10. When the price exceeds €12 (the neckline), with an explosion of volumes, it means that buyers have definitely taken over, and the stock could aim for €14 (if €2 is the distance between the bottom and the neckline).
Why Does the Double Bottom Work? The Psychology Behind the Pattern
The reason the Double Bottom is so effective lies in market psychology:
- Seller Exhaustion: The first decline and subsequent bounce indicate that, at that price level, there is buying interest. The second decline, which fails to break below the first bottom, confirms that sellers no longer have the strength to push the price lower.
- Buyer Confidence: When buyers see that the price cannot fall beyond a certain point, their confidence increases. The neckline breakout is definitive proof that demand is overcoming supply, triggering a wave of purchases.
Final Considerations: Prudence First
The Double Bottom is a powerful pattern, but like any technical analysis tool, it is not infallible. It is crucial to use it in combination with other indicators and analysis principles (such as volume analysis, momentum indicators, etc.) to increase its reliability. Always remember that risk management is crucial: always define your stop loss before entering a trade.
I hope this deep dive into the world of the Double Bottom has been useful to you. Keep studying, practicing, and applying what you learn. Markets are a continuous challenge, but with the right tools, you can learn to navigate their waves!
Happy trading!