Doji Star: A Warning Signal Not to Underestimate
Welcome everyone, market enthusiasts and those curious about technical analysis! Have you ever looked at a chart and felt that something is about to change, but you don’t know exactly what or why? Often, the most powerful signals are right there, hidden in simple candlestick formations that, if read correctly, can offer us a competitive edge. Today, we’ll talk about one such signal: the Doji Star. It’s not just a nice name, but a genuine alarm bell that every trader should learn to recognize.
Get ready to discover how this peculiar candlestick configuration can indicate an imminent reversal or, in some rare cases, a continuation, and how to best utilize it in your trading!
What is the Doji? The “Heart” of the Star
Before delving into the “Star,” we need to understand the “Doji” that forms its core. Imagine the market as an arena where bears (sellers) and bulls (buyers) clash. A Doji candle is a clear sign of indecision: the open and close prices are equal or very close to each other, forming an almost non-existent body. The “shadows” (the vertical lines showing the highs and lows) can be long, but the essence is that neither buyers nor sellers managed to significantly prevail.
When you see a Doji, think of a soccer match ending in a draw. It’s a moment of pause, of reflection, often a prelude to a new attack from one of the two teams.
The Doji Star Pattern: A Revealing Combination
The Doji Star is not a single candle, but a three-candle formation that tells a complete story of indecision and potential reversal. Imagine the Doji as the actual star, but to form a significant “constellation,” it needs two other candles around it.
Here’s how its structure appears, in both bullish and bearish versions:
- First Candle: A significant-sized candle that follows the preceding trend. If we are in a bearish trend, it will be a large black (or red) candle. If we are in a bullish trend, it will be a large white (or green) candle. This candle shows the strength and continuation of the ongoing trend.
- Second Candle (The Doji): Here comes the “star.” This is a Doji that forms with a gap (an empty space) relative to the real body of the first candle. This gap is crucial: it signals that the opening of the next day occurred far from the previous close, indicating a sudden lack of conviction in the ongoing trend. The Doji itself, as we’ve seen, is a sign of indecision.
- Third Candle: This is the confirmation candle. It’s a candle that moves in the opposite direction to the preceding trend, often with a significant real body, and ideally closes within the body of the first candle. It’s as if the market has decided: “Okay, the draw is over, now we’re going in the other direction!”
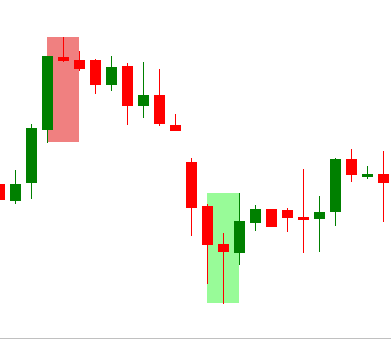 ◎ Struttura del Pattern Doji Star (Rialzista e Ribassista) (Graphical representation of the three candles that compose the Doji Star pattern, highlighting the gap and the confirmation.)
Bullish Doji Star (Morning Doji Star): Light After Darkness
The Morning Doji Star is a bullish reversal pattern that forms after a downtrend.
- Candle 1: A long black (bearish) candle confirming selling pressure.
- Candle 2 (Doji): The Doji forms with a gap down from the close of the first candle. This indicates that, despite the initial pressure, the market found a point of balance, with neither bears nor bulls managing to take control.
- Candle 3: A long white (bullish) candle that opens with a gap up from the Doji and closes well within the body of the first bearish candle. This is the reversal signal: buyers have returned with strength.
The Morning Doji Star suggests that the sell-off is losing momentum and that buyers are beginning to take control, foreshadowing a potential rally.
Bearish Doji Star (Evening Doji Star): Twilight on the Uptrend
The Evening Doji Star is a bearish reversal pattern that forms after an uptrend.
- Candle 1: A long white (bullish) candle indicating that buyers are in control.
- Candle 2 (Doji): The Doji forms with a gap up from the close of the first candle. Once again, it’s a sign of indecision at a higher price, a potential exhaustion point for buyers.
- Candle 3: A long black (bearish) candle that opens with a gap down from the Doji and closes well within the body of the first bullish candle. This is the signal that sellers have taken over, pushing prices lower.
The Evening Doji Star warns that buying pressure is diminishing and that sellers are ready to take control, indicating a potential decline.
Why Does the Doji Star Work? The Psychology Behind the Pattern
The power of the Doji Star lies in its ability to tell a clear psychological story of the market:
- Trend Exhaustion: The first candle shows the strength of the trend. But the gap and the subsequent Doji indicate that this strength is diminishing. Buyers (or sellers) who had been in control can no longer push prices with the same conviction.
- Indecision and Battle: The Doji represents a moment of precarious balance, of uncertainty. The market is awaiting a new catalyst.
- Confirmation of Victory: The third candle leaves no doubt. It shows that one of the two parties (buyers or sellers) has decisively taken over, reversing the direction of momentum.
It’s like a boxer landing blow after blow (first candle), then getting tired and freezing (Doji), and finally the opponent seizing the opportunity to land the decisive punch (third candle).
How to Use the Doji Star in Trading: Practical Tips
The Doji Star is a powerful signal, but like any technical analysis tool, it should be used wisely and in combination with other indicators. Here are some tips:
- Context is Everything: The Doji Star is more reliable when it appears after a well-defined and significant trend (bullish for the Evening Star, bearish for the Morning Star). Don’t give it too much importance if the market is consolidating or moving sideways.
- Confirmation Volumes: Look for an increase in volumes on the third candle. High volumes during the confirmation candle strengthen the validity of the signal, indicating massive participation in the reversal movement.
- Key Levels: The pattern is even more powerful if it forms near support levels (for the Morning Doji Star) or resistance (for the Evening Doji Star), or in conjunction with important moving averages or trend lines.
- Confirmation from Other Indicators: Don’t be fooled by a single signal. Combine it with indicators like RSI (Relative Strength Index) which shows overbought/oversold, MACD (Moving Average Convergence Divergence) for crossovers, or even simple chart patterns like double tops/bottoms.
- Mandatory Stop Loss: If you enter a position based on a Morning Doji Star, place your stop loss below the low of the Doji candle (or the third candle if its low is lower). For an Evening Doji Star, place the stop loss above the high of the Doji (or the third candle). This is fundamental for risk management.
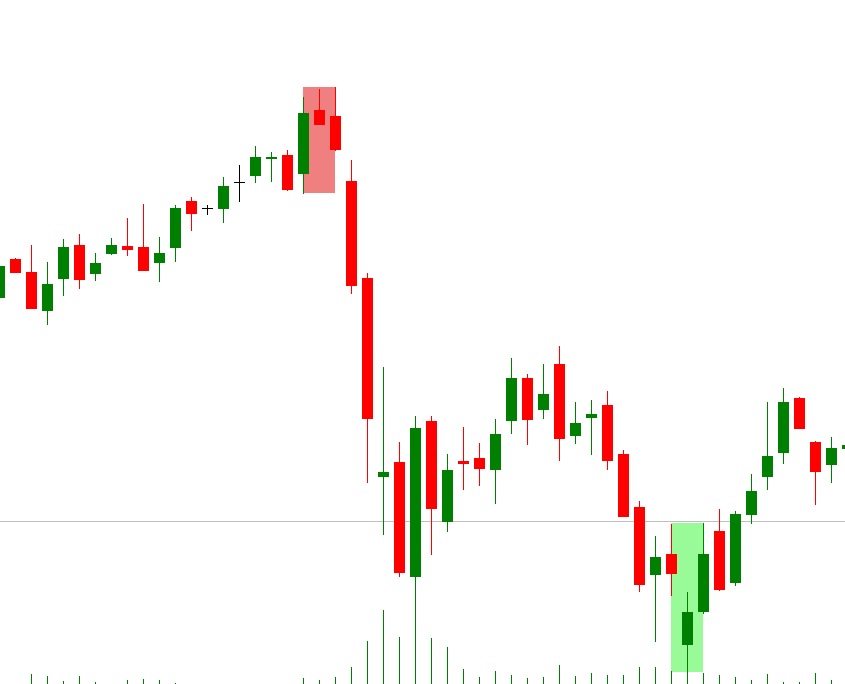 ◎ Applicazione del Doji Star in un contesto di mercato reale (An example of a financial chart showing the appearance of a Morning Doji Star after a downtrend and an Evening Doji Star after an uptrend, with arrows indicating the reversal.)
Limitations and Warnings
Even the Doji Star, like all patterns, is not infallible. “False signals” can occur, especially in illiquid markets or during periods of high volatility. Always remember:
- Not an Isolated Signal: Its strength lies in context. Never base a trading decision solely on this pattern.
- Requires Patience: Always wait for the close of the third candle for confirmation. Entering earlier can be premature and risky.
- Adaptability: “Gaps” are not always perfect, especially on less liquid assets. The important thing is that the Doji’s body is clearly separated from the body of the preceding candle.
Conclusion
The Doji Star is a fascinating and powerfully indicative candlestick pattern, capable of precisely signaling turning points in the market. Recognizing it and understanding its underlying psychology can give you a significant edge in predicting trend reversals.
Remember, technical analysis is both an art and a science, and every pattern is a piece of a larger puzzle. Continue to study, practice, and combine information to make more informed and conscious trading decisions. The “star” is there to guide you, but it’s up to you to interpret its light!
Happy trading!