Hello everyone, market enthusiasts and curious minds of the financial world!
If you’ve ever wondered how traders and analysts manage to “read” charts and understand where an asset is headed, you’re in the right place. The secret, or at least a fundamental part of it, lies in identifying market trends. Learning to recognize the main direction in which price is moving is like having a compass on a journey: without it, you risk navigating blindly and getting lost.
Today, we’ll explore together what trends are, why they are so important, and most importantly, how you can identify and draw them with one of the simplest yet most effective tools in technical analysis: trendlines.
What is a Trend? The Market’s Direction
Imagine a stock’s price as a flowing river. The trend is its main current. Even if there are eddies, rapids, and bends (representing daily fluctuations), the river’s general current has a precise direction: it flows downstream, goes upstream (if we think of waterfalls or elevation changes), or moves more slowly across a plain.
In terms of financial markets, a trend is nothing more than the prevailing direction in which an asset’s price is moving over a significant period of time. It’s not a linear movement, but rather a series of highs and lows that, taken together, indicate a clear direction.
Why Are Trends So Important?
Understanding the direction of the trend is fundamental for several reasons:
- Guides Decisions: “Trade with the trend” is one of the oldest and wisest maxims in trading. Operating in the direction of the trend increases the probabilities of success.
- Identifies Supports and Resistances: Trendlines often act as dynamic support levels (for uptrends) and resistance levels (for downtrends).
- Warns of Changes: The break of a trendline can signal a potential trend exhaustion or even a reversal.
- Measures Strength: The angle of a trendline can indicate the speed and strength of the trend.
The Three Main Types of Trends
There are fundamentally three types of trends that we can observe on charts:
1. Uptrend (or Bullish Trend)
An uptrend occurs when the price of an asset is generally rising. On the chart, this manifests as a series of higher highs and higher lows. It’s every investor’s dream, the phase where “the market is Bullish,” which pushes prices upwards.
How to draw an uptrend trendline: To draw a valid uptrend trendline, you need to connect at least two (preferably three or more) consecutive higher lows. This line, extended over time, acts as a dynamic support, suggesting that whenever the price drops towards it, it might find a “floor” and bounce.
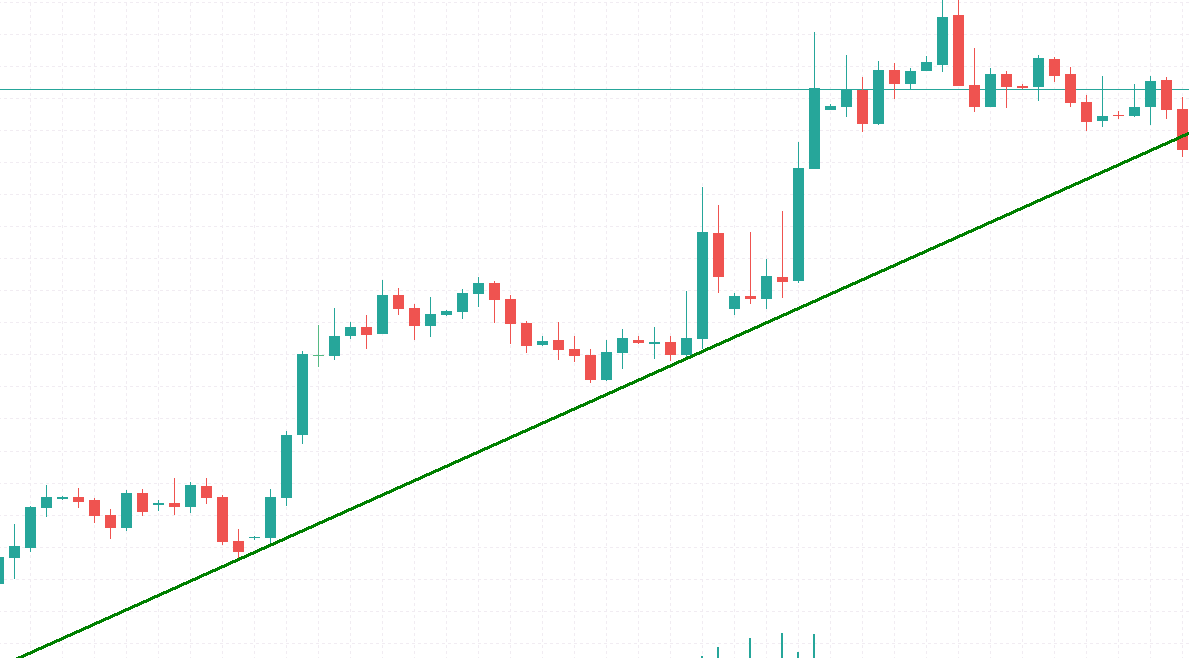 ◎ Esempio di Trend Rialzista con Trendline
(This chart shows an asset’s price forming higher highs and higher lows, with an uptrend trendline drawn below the lows to indicate dynamic support.)
◎ Esempio di Trend Rialzista con Trendline
(This chart shows an asset’s price forming higher highs and higher lows, with an uptrend trendline drawn below the lows to indicate dynamic support.)
2. Downtrend (or Bearish Trend)
A downtrend is the opposite of an uptrend. The asset’s price is generally falling, characterized by a series of lower highs and lower lows. This is the phase where “the market is Bearish,” which pushes prices downwards.
How to draw a downtrend trendline: To draw a downtrend trendline, we connect at least two (preferably three or more) consecutive lower highs. This extended line acts as dynamic resistance, indicating that whenever the price rises towards it, it might encounter a “ceiling” and turn downwards again.
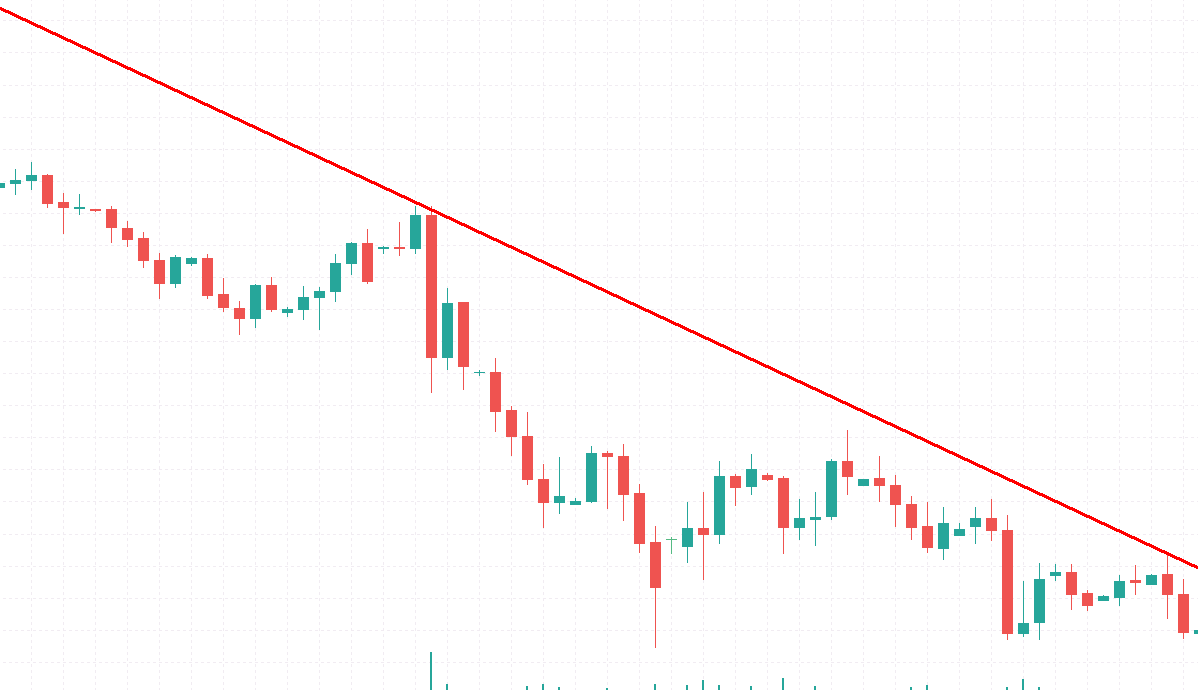 ◎ Esempio di Trend Ribassista con Trendline
(This chart illustrates an asset’s price forming lower highs and lower lows, with a downtrend trendline drawn above the highs to indicate dynamic resistance.)
◎ Esempio di Trend Ribassista con Trendline
(This chart illustrates an asset’s price forming lower highs and lower lows, with a downtrend trendline drawn above the highs to indicate dynamic resistance.)
3. Sideways Trend (or Trading Range)
Finally, we have the sideways trend, also known as a consolidation phase or trading range. In this scenario, the price moves horizontally, without a clear uptrend or downtrend direction. It’s like a river flowing across a plain: there’s water, but its general direction is less evident, oscillating between two well-defined “banks.”
On the chart, a sideways trend is characterized by a series of highs and lows approximately at the same level. The price bounces between a support level (the floor) and a resistance level (the ceiling).
How to draw a sideways trendline: In this case, two horizontal lines are drawn: one at the lows (support) and one at the highs (resistance). A break of one of these lines can indicate the beginning of a new uptrend or downtrend.
Golden Rules for Drawing Effective Trendlines
Drawing trendlines is not an exact science, but following some guidelines can improve their reliability:
- Two Points are Enough, Three or More Confirm: To draw a trendline, you need to connect at least two points. However, a trendline is considered more reliable and significant if it touches (or almost touches) three or more points. The greater the number of touches, the higher the validity of the trend.
- Angle Matters: Trendlines that are too steep might not be sustainable in the long term. Trendlines with a moderate angle tend to be more robust.
- Don’t Force Trendlines: If a trendline doesn’t naturally align with the highs or lows, don’t force it. There might not be a clear trend, or the trendline might not be valid.
- Consider Volume: A breakout (break) of a trendline accompanied by high volume is generally more significant.
- Multitimeframe: Trendlines can be drawn on any timeframe (daily, hourly, weekly). A trend visualized on a larger timeframe (e.g., weekly) generally carries more weight than one on a smaller timeframe (e.g., 15 minutes).
When Does a Trend Change? The Trendline Break
The moment a trendline is violated (i.e., the price crosses it and closes beyond it) is an important signal. It doesn’t always indicate an immediate reversal, but it suggests that the strength of the previous trend is weakening.
A break can mean:
- A pause or consolidation of the trend.
- A complete trend reversal (from uptrend to downtrend, or vice versa).
- A shift to a sideways trend.
It’s crucial not to act impulsively on the first break: traders often wait for confirmation, such as a significant candle close beyond the trendline or a “retest” of the broken level.
Conclusion: The Trader’s Compass
Understanding and using trendlines to identify market trends is one of the most basic and powerful skills an analyst or trader can acquire. It provides you with a compass to navigate the markets, helping you make more informed decisions and manage risk more effectively.
Remember, technical analysis is not a crystal ball, but a tool to increase the probabilities in your favor. Practice drawing trendlines on different charts and timeframes, observe how prices behave, and with time, it will become second nature.
Keep learning and practicing. See you in the next analysis!