Hello everyone, future explorers of financial markets! Have you ever been fascinated or, perhaps, a bit intimidated by those charts full of lines, candlesticks, and indicators you see when someone talks about investments or trading? Well, you’re in the right place! Today we’ll shed light on one of the most popular approaches to understanding what an asset’s price might do in the future: Technical Analysis.
If you think that to invest, all you need to know is whether a company produces good products or has a charismatic CEO, you’re mistaken (or rather, you’re missing a piece of the puzzle!). Technical analysis is a world of its own, focusing on what prices and volumes tell us directly from the market. Get ready, because we’re about to unmask the secrets behind those waves and peaks!
What is Technical Analysis? The Heart of the Matter
Imagine you’re a meteorologist. To predict tomorrow’s weather, you’re not interested in how the atmosphere was built or its exact chemical components. What you do is study historical data: past temperatures, atmospheric pressure, cloud movements, wind speed. Based on these patterns, you formulate a forecast.
Technical analysis does exactly this, but with financial markets. Instead of looking at a company’s financial statements or global economic news, the technical analyst focuses on the price movement and trading volumes of an asset (stocks, cryptocurrencies, commodities, currencies, etc.) in the past, to predict its probable future moves.
The underlying philosophy is simple, summarized in these key points:
- Price discounts everything: Every piece of information available on the market – economic news, investor expectations, geopolitical events – is already reflected in the asset’s current price. There’s no need to dig for hidden data; the market has already incorporated everything.
- History repeats itself: Price patterns tend to repeat over time because they are the result of human psychology, which is constant. Investors’ fears, greed, and hopes manifest in recurring chart patterns.
- Price movement is in trends: Prices tend to move in specific directions (upward, downward, or sideways trends) for prolonged periods. The analyst’s job is to identify these trends and ride them.
The main tools of a technical analyst are charts. We’re not just talking about simple lines, but complex representations like Japanese candlesticks or bar charts, which show the open, close, high, and low of a price over a specific period. On these charts, technical indicators (such as Moving Averages, RSI, MACD) are then applied, and chart patterns (such as “head and shoulders,” “double bottoms/tops”) are sought, which are signals of possible future price movements.
A fundamental concept is that of Support and Resistance. Imagine the price as a ball bouncing between a floor (support) and a ceiling (resistance). When the price falls and touches a support level, there’s a higher probability it will bounce upwards, because demand exceeds supply. Conversely, when it rises and touches resistance, there’s a higher probability it will be rejected downwards, because supply exceeds demand. The break of these levels can signal a change in trend.
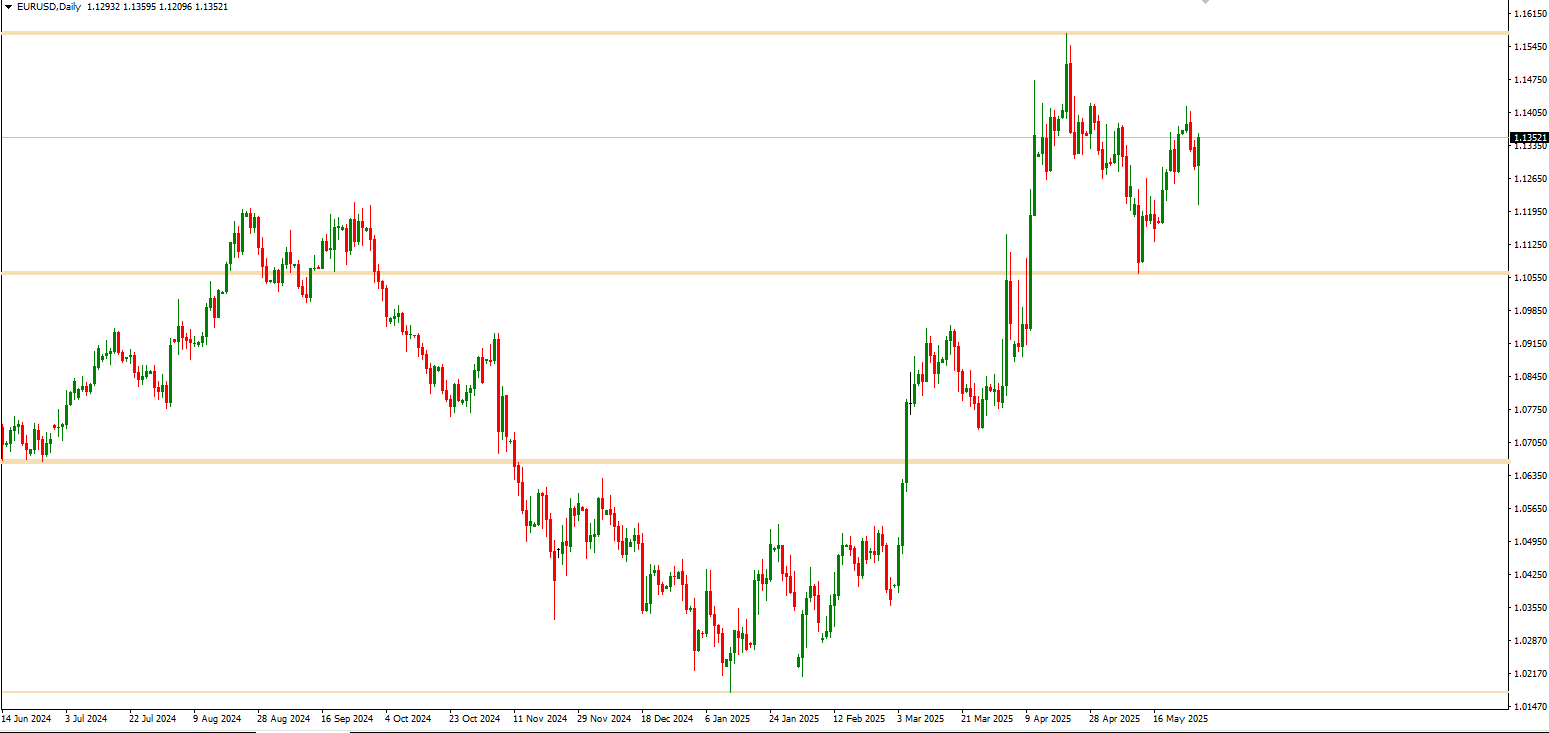 ◎ Esempio di Livelli di Supporto e Resistenza su un Grafico (A financial candlestick chart showing horizontal and oblique lines indicating price levels where the trend has found support or resistance in the past.)
The Purposes of Technical Analysis: Why Do We Use It?
Technical analysis is not a crystal ball, but a tool to improve probabilities and make more informed decisions. Its main purposes are:
- Identify Market Direction (Trend): Understand whether an asset is rising (uptrend), falling (downtrend), or moving sideways (sideways trend). This is crucial for “riding the right wave.”
- Predict Potential Trend Reversals: Identify signals suggesting that an established trend might lose strength or reverse, allowing you to exit a profitable position or prepare to enter in the opposite direction.
- Determine Optimal Entry and Exit Points: It helps traders decide when to buy and when to sell an asset, optimizing profit potential and limiting losses. For example, you might decide to buy when the price “bounces” off a support and sell when it reaches a resistance.
- Manage Risk: Define “stop loss” levels (the maximum acceptable loss price) and “take profit” levels (the price at which you want to realize profit) based on logical points on the chart, such as key supports and resistances.
Technical Analysis vs. Fundamental Analysis: Two Sides of the Same Coin (but different!)
Here’s where confusion often arises. Technical analysis and fundamental analysis are two completely different approaches to analyzing markets, but they are not enemies. In fact, they can be allies!
| Characteristic | Technical Analysis | Fundamental Analysis |
|---|---|---|
| Focus | The price behavior and volume on the chart. | The intrinsic value of an asset (e.g., a company’s financial health). |
| Data Used | Historical price charts, technical indicators, trading volumes. | Company financial statements, earnings, economic news, interest rates, industry, management. |
| Key Question | “What is the market doing?” and “When is the best time to act?” | “What is this asset really worth?” and “Why is it rising/falling?” |
| Time Horizon | Generally more geared towards the short to medium term, but applicable to all. | Primarily geared towards the long term. |
| Metaphor | The meteorologist studying climate patterns to predict weather. | The detective investigating the facts and causes behind the scenes. |
The fundamental analyst tries to understand why a company (or an economy) should succeed, and therefore how much its stock should be worth. They focus on the “true essence” of the asset. The technical analyst, on the other hand, doesn’t care why a price moves, but how it moves and where it might go based on its past behavior.
Many experienced investors use both approaches: fundamental analysis to choose “what” to buy (solid companies, promising cryptocurrencies), and technical analysis to decide “when” to buy or sell to optimize timing and risk management.
Who is Technical Analysis For?
Technical analysis is a valuable tool for:
- Short to medium-term traders: Essential for those who want to capitalize on fast price movements and short-term trends.
- Long-term investors: Useful for optimizing entry points (avoiding buying at all-time highs) and exit points, or for managing risk on their positions.
- Anyone who wants to understand market psychology: Studying charts means studying the collective behavior of millions of investors.
- Those seeking a data-driven approach: Charts speak clearly, and their information is public and accessible to all.
Conclusion: The Chart is Your Battlefield
I hope this beginner’s guide has given you a clear idea of what technical analysis is and why it’s such a powerful tool in the world of financial markets. It’s not magic, but an art based on probability and an understanding of human behavior reflected in prices.
Remember, no analysis method is infallible. Markets are complex and unpredictable. However, technical analysis provides you with a map, a compass, and a set of tools to navigate these waters, helping you make more informed decisions and manage your risk.