Hello Traders and Market Enthusiasts!
Often, when we talk about technical analysis, attention focuses almost exclusively on price: how it moves, where it stops, what patterns it draws. And rightly so, price is obviously the protagonist. But there’s a silent “co-protagonist” operating behind the scenes that is fundamental to understanding the true story the market is telling: volume.
Volume is like the crowd watching a show: it doesn’t tell you what will happen next, but it helps you understand how engaging the show is at that moment and how much force is behind the ongoing action. Ignoring volume is like listening only to an actor’s words without paying attention to the murmur or enthusiasm of the audience.
If you’re ready to discover how this indicator can revolutionize your market reading, make yourself comfortable: let’s begin!
What Exactly Is Volume? (And Why Is It Different in Forex?)
In simple terms, volume represents the total number of contracts or shares traded within a specific period (e.g., an hour, a day, a candlestick). It is a measure of an asset’s trading activity and liquidity. High volume indicates that many transactions have occurred, while low volume suggests little activity.
Imagine an auction: the price is the final bid, but the volume is how many people actively participated, how many bids were made. More bids mean the price is more “confirmed” by a solid base of participants.
Traditional Volume vs. Tick Volume in Forex
Here comes a crucial difference, especially for those trading in Forex.
- Traditional Volume (Stock Markets, Futures, Cryptocurrencies): In these markets, volume is typically real volume, meaning the actual number of shares or contracts traded. It is centralized and precise data, provided by stock exchanges.
- Tick Volume (Spot Forex Market): The spot Forex market is decentralized (Over-The-Counter, OTC). There is no central exchange that records all global transactions. For this reason, trading platforms (like MetaTrader) cannot provide you with real volume. What you see is tick volume. Tick volume measures the number of price changes (ticks) that occur within a given period. Every time the price changes, even by a fraction of a pip, a tick is recorded. So, if the price of EUR/USD changes 100 times in a minute, the tick volume for that minute will be 100.
“But then is tick volume useless?” Absolutely not! Even if it’s not real volume, tick volume is an excellent proxy for market activity. A higher number of ticks indicates that there is more trading activity happening, more exchanges, more participants moving the price. The fewer the ticks, the lower the activity.
It’s like the noise in a public square: you don’t know exactly how many people are there, but if the noise is deafening, you understand there’s a huge crowd and a lot of activity. If there’s silence, you understand the square is empty. Tick volume gives us an idea of the market’s “noisiness.”
Why Is Volume So Important in Technical Analysis?
Volume is not an indicator that predicts the future, but rather a confirmation indicator. It tells us how solid and sustainable a price action is.
Think of it this way: price shows you the direction, volume shows you the force behind that direction.
- Market Conviction: A price movement accompanied by high volume suggests there’s widespread participation and conviction among traders regarding that movement. It’s more likely to be a genuine and sustainable movement.
- Market Doubt: Conversely, a price movement with low volume indicates that few traders are involved. It could be a weak, unsustainable movement, or even a “trap” (false breakout).
How to Interpret Volume Signals: The Keys to Reading
Now, let’s get to the crux: how do we translate the ’noise’ of volume into useful information for our trading?
1. Volume and Trends
Volume is an excellent indicator of a trend’s health.
- Strong and Healthy Bullish Trend: Price rises and volume increases concurrently with bullish candlesticks, slightly decreasing during retracements (bearish candlesticks). This indicates that buyers are in control and there is strong interest in pushing the price higher.
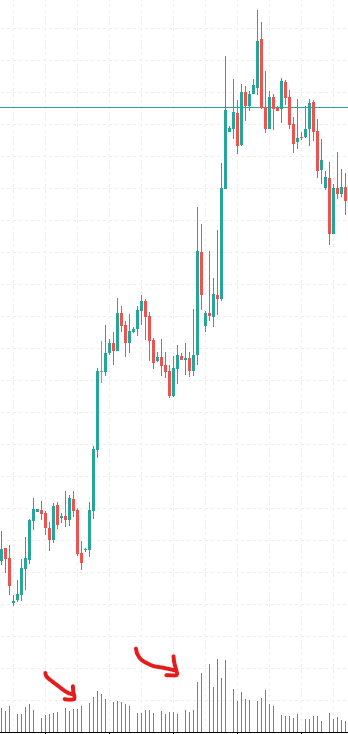 ◎ Example of Volume Confirming a Bullish Trend (Chart showing a bullish trend with volume bars increasing on upward movements and decreasing on retracements.)
 - Strong and Healthy Bearish Trend: Symmetrically, price falls and volume increases concurrently with bearish candlesticks, slightly decreasing during bounces (bullish candlesticks). Sellers are in control and there is strong downward pressure.
- Weak or Exhausted Trend: If the price continues to move in one direction (either up or down) but volume begins to decrease, it’s a warning sign. It indicates that the pressure in that direction is falling, fewer participants are interested in sustaining the movement, and a reversal or consolidation might be imminent.
2. Volume and Trend Reversals
Volume can be a powerful indicator of potential reversals.
- Volume Climax: Often, an unusually high volume spike (a true “climax”) at the end of a significant trend can signal the exhaustion of the movement. This is when everyone who wanted to buy (or sell) has done so, and the market no longer has the “fuel” to continue in the same direction. It’s a final “push” before a collapse (or bounce).
- Divergences: If price reaches new highs (or new lows) but volume does not confirm this new extreme (i.e., volume is lower than previous highs/lows), this is a divergence and a strong signal of trend weakening, preceding a potential reversal.
3. Volume and Breakouts
Breakouts of key levels (support, resistance, trendlines) are among the most important setups for many traders. Volume is essential for validating them.
- Confirmed Breakout: A breakout of a key level with a significant increase in volume is considered strong and reliable. It indicates that there is great pressure from buyers or sellers pushing the price beyond that level, and many participants are involved. The movement is more likely to continue in the direction of the breakout.
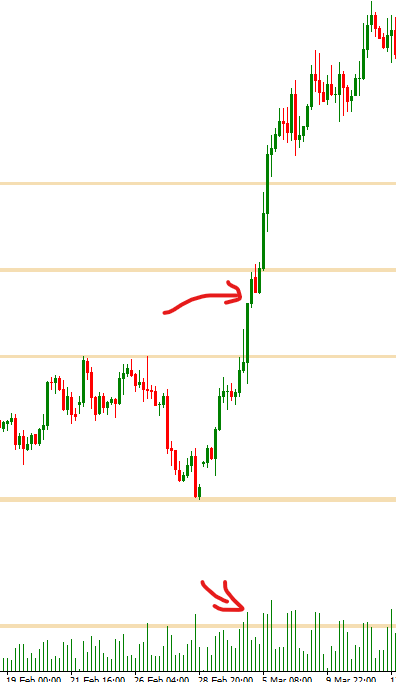 ◎ Resistance Breakout Confirmed by a Volume Spike (Chart showing a candlestick breaking a horizontal resistance, accompanied by a volume bar significantly higher than average.)
 - False Breakout: A breakout that occurs with low or decreasing volume is a warning sign. It could be a “trap” for traders, who enter in the direction of the breakout only to see the price quickly return to the range. Low volume indicates that there is no strong conviction behind the breakout.
4. Volume and Consolidation Phases
During consolidation or range phases (when price moves sideways), volume tends to decrease. This indicates a phase of indecision or accumulation/distribution:
- Accumulation/Distribution: Often, volume decreases as price consolidates. This can mean that “smart money” operators are accumulating (secretly buying) or distributing (secretly selling) positions before the next big move. A sudden increase in volume outside the consolidation range will signal the start of a new trend.
Limitations and Final Considerations
- Volume is Not a Standalone Indicator: Like all indicators, volume should not be used alone. It is a powerful confirmation tool, but it should always be combined with price action analysis, support and resistance, and other indicators you use.
- Context is King: Always interpret volume in the context of the timeframe you are analyzing and the overall market situation. High volume on a 1-minute timeframe has a different meaning than high volume on a daily chart.
- Tick Volume vs. Real Volume: Always remember the distinction in Forex. Tick volume is a proxy, not real volume. But for the vast majority of retail traders, it is the only tool available and is still extremely effective if used correctly.
Conclusion
Volume, or tick volume in Forex, is an often-underestimated technical analysis indicator that holds valuable information about the health and strength of price movements. It helps us understand how convinced market participants are behind a particular move, identify potential reversals, and validate breakouts of key levels.
Learning to read volume will give you a deeper perspective on the market, transforming the simple “what” (price) into a “what and with how much force” (price and volume). Start observing it on your charts, pay attention to its variations, and you will see how your understanding of market activity will become much more complete.
Happy trading!