Hello trading friends and market enthusiasts!
Today we delve into one of the most fascinating yet elusive tools of technical analysis: the Doji candlestick. If you’ve ever observed a Japanese candlestick chart, you’ve probably come across this small candle with an almost non-existent body. But don’t let its size fool you: the Doji is a powerful signal, a true white flag raised by bulls and bears, whispering a key word to us: indecision.
Ready to discover what it means and, above all, how to interpret it correctly to make more informed decisions? Let’s go!
What is a Doji Candlestick?
Imagine the market as a battlefield where buyers (“bulls”) and sellers (“bears”) constantly clash. Each Japanese candlestick tells the story of this battle over a specific period.
A Doji candlestick forms when an asset’s opening price and closing price are virtually identical, or very close. Visually, this translates into a candle with an extremely small or almost absent “body” (the rectangular part indicating the difference between open and close), and “shadows” (the thin lines above and below the body) that indicate the maximum and minimum prices reached during that period.
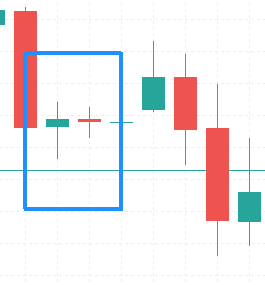 ◎ Comprendere la struttura di una candela Doji (Illustrazione di una candela Doji con evidenziate l’apertura, la chiusura, il massimo e il minimo, e il corpo quasi inesistente.)
Why indecision? Simple: the fact that the open and close are nearly equal means that, despite attempts by buyers and sellers to push the price up or down, neither managed to gain the upper hand by the end of the period. The battle ended in a tie, a stalemate.
The Doji Candlestick Variants: A Family with Different Personalities
Not all Dojis are alike. The lengths and positions of the shadows can give us different nuances about the ongoing indecision. Here are the main variants:
1. Standard Doji (or Classic Doji)
It is the most common, with upper and lower shadows of similar length.
- Meaning: Balanced equilibrium between bullish and bearish pressure. It is a neutral signal of pure indecision.
2. Long-Legged Doji
This Doji features significantly longer upper and lower shadows compared to the standard Doji.
- Meaning: Indicates that there was strong activity from both buyers and sellers during the period, with the price fluctuating wildly, but ultimately returning to the starting point. There was a lot of action, but without a clear winner. It signals a much more volatile and uncertain indecision.
3. Dragonfly Doji
This Doji has a very long lower shadow and almost no upper shadow. The opening, high, and closing prices are all at the same level (or nearly so) and coincide with the highest point of the period.
- Meaning: It looks like an inverted “T”. It suggests that sellers tried to push the price very low, but buyers intervened strongly, bringing the price back near the open/high point. If it appears after a downtrend, it can be a bullish signal, indicating a potential reversal.
4. Gravestone Doji
Exactly the opposite of the Dragonfly. It has a very long upper shadow and almost no lower shadow. The opening, low, and closing prices are all at the same level (or nearly so) and coincide with the lowest point of the period.
- Meaning: It looks like a “T”. It implies that buyers attempted to push the price very high, but sellers took control, bringing the price back near the open/low point. If it appears after an uptrend, it can be a bearish signal, indicating a potential reversal.
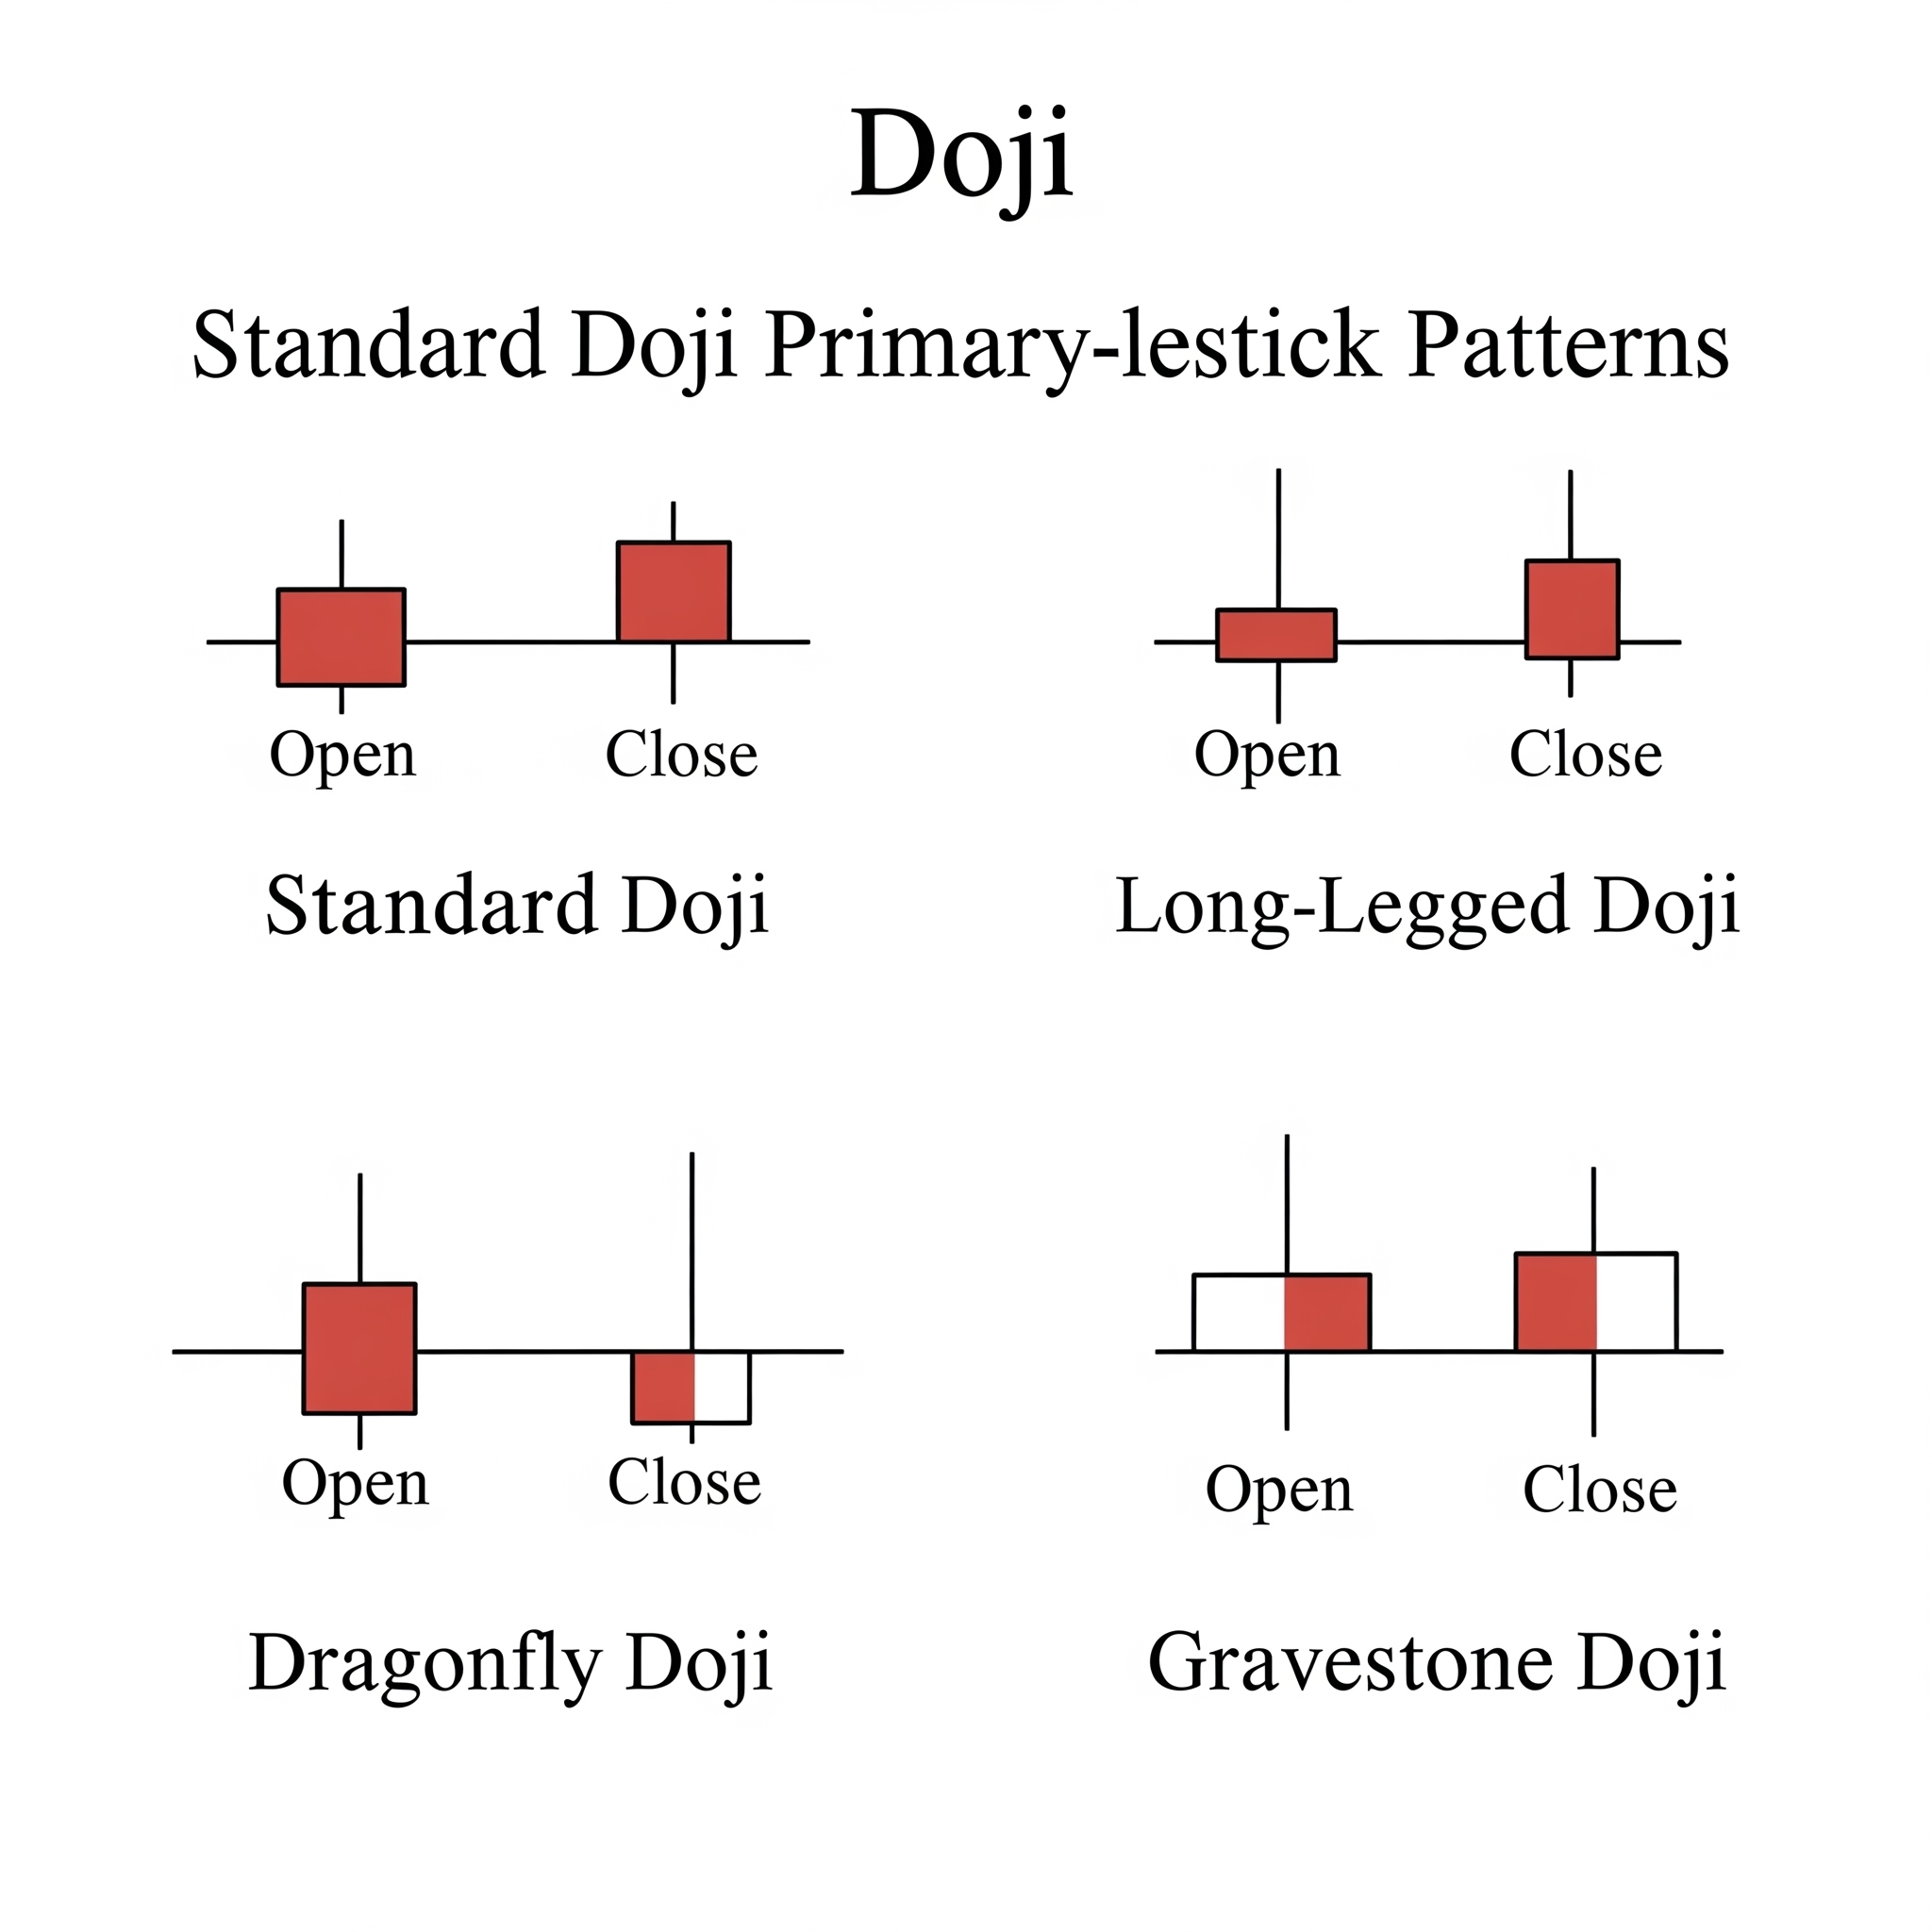 ◎ Le diverse forme delle candele Doji e il loro significato (Illustrazione schematica delle quattro varianti principali di Doji, mostrando le diverse lunghezze e posizioni delle ombre per ciascuna.)
The Doji as an Indecision Signal: Context is King!
Now for the most important part: the Doji alone is not an operational signal. A Doji can only be interpreted based on the context in which it appears.
1. Doji after a Strong Trend (Potential Reversal)
This is the most significant context.
- After a strong uptrend: If you see a Doji after a long period of growth, it’s as if the market pauses to reflect. Buyers, who previously dominated, can no longer push the closing price higher than the opening price. This may indicate that bullish momentum is exhausting and a bearish reversal might be imminent. The Gravestone Doji in this context is particularly alarming for bulls.
- After a strong downtrend: Symmetrically, if a Doji appears after a sharp decline, it suggests that sellers are losing their grip. Prices have fallen, but buyers have stepped in, nullifying part of the decline. This could signal a potential bullish reversal. The Dragonfly Doji is very interesting in this situation.
2. Doji within a Range or Consolidation
If a Doji appears when the price is moving sideways (a “range” or “trading range”), its importance as a reversal signal is much lower. In this case, it simply confirms that the market is already in a state of indecision. It may indicate the continuation of consolidation or, if accompanied by other signals, the possible breakout of the range.
3. The Importance of Volume
A Doji accompanied by high volume is usually more significant. High volume on a Doji means there was a large amount of trading, but without a clear direction. This strengthens the idea that the battle between bulls and bears was intense but without a winner, indicating a potential turning point.
4. Confirmation from Other Indicators
Never rely on a single signal. Use the Doji in combination with other technical analysis tools:
- Support and Resistance: A Doji that forms on a key support or resistance level is much more powerful.
- Momentum Indicators: RSI, Stochastic, or MACD can help confirm trend exhaustion.
- Subsequent Candlesticks: The candlestick following the Doji is crucial. If, after a bearish Doji (Gravestone) in an uptrend, the next candlestick is a strong bearish candle, the reversal signal is much more credible.
Conclusion: The Doji, A Warning of Caution
The Doji candlestick is a lesson in humility from the market. It is not an immediate “go long” or “go short” signal, but rather a warning: “Caution! The market is uncertain. Evaluate the situation carefully before acting.”
Understanding the Doji and its variants will allow you to better read market psychology, recognizing moments of indecision and, most importantly, knowing when it’s time to wait for confirmation before taking a position. Always remember: context is everything, and combining it with other indicators is the key to effective technical analysis.
Happy conscious trading!