Price Channels: Navigating Parallel Bands
Hello, aspiring traders and financial market enthusiasts! Today, we’re diving into one of the most intuitive and powerful tools in technical analysis: price channels. Imagine the price of an asset as a car traveling along a highway. Price channels are precisely the lanes of this highway, guiding price movement and offering valuable insights into where it might be headed next.
Understanding how to draw and interpret these “parallel bands” can give you a significant advantage, allowing you to identify potential entry and exit points, as well as anticipate possible reversals or trend continuations. Are you ready to navigate these invisible yet fundamental lanes? Let’s get started!
What Are Price Channels?
In simple terms, a price channel consists of two parallel trend lines that act as dynamic support and resistance for an asset’s price. The price tends to move within these two lines, bouncing between the “floor” (the support line) and the “ceiling” (the resistance line).
These channels can be of three main types:
- Ascending (or Bullish): indicate an upward trend.
- Descending (or Bearish): indicate a downward trend.
- Sideways (or Ranging): indicate a consolidation phase without a clear direction.
Their utility lies in their ability to define a price movement range, providing a clear visual structure of the trend and its boundaries.
Drawing Channels: The Practical Method
Drawing a channel is simpler than it seems. The key is to correctly identify the price’s contact points with the support and resistance lines.
1. Ascending (Bullish) Channels
An ascending channel forms when the price of an asset records progressively higher lows and higher highs.
How to draw them:
- Lower line (Support): Connect at least two (ideally three or more) consecutive higher lows. This line represents the dynamic “floor” of the bullish trend.
- Upper line (Resistance): Draw a line parallel to the support line, touching at least two (ideally three or more) consecutive higher highs within the same period. This line acts as the dynamic “ceiling”.
Trading interpretation:
- Strategy: Traders look for buying (long) opportunities when the price approaches or touches the lower support line, anticipating a bounce towards the upper resistance line. Selling (short) opportunities may arise at the resistance line, although in a bullish trend they are generally less preferred or riskier unless one is looking for a short-term trade.
- Breakout: A decisive break above the resistance line can signal an acceleration of the bullish trend. Conversely, a break below the support line indicates a weakening of the trend, a potential reversal, or the start of a new bearish trend.
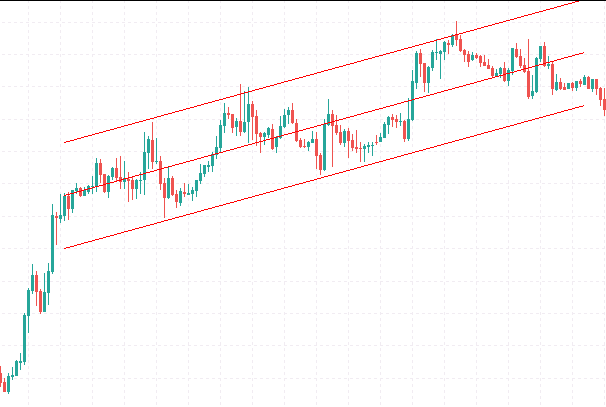 ◎ Canale di Prezzo Ascendente: Identificazione del Trend Rialzista (Immagine di un grafico a candele con una linea di supporto ascendente che collega i minimi crescenti e una linea di resistenza parallela che collega i massimi crescenti.)
2. Descending (Bearish) Channels
A descending channel forms when the price of an asset records progressively lower highs and lower lows.
How to draw them:
- Upper line (Resistance): Connect at least two (ideally three or more) consecutive lower highs. This line is the dynamic “ceiling” of the bearish trend.
- Lower line (Support): Draw a line parallel to the resistance line, touching at least two (ideally three or more) consecutive lower lows within the same period. This line acts as the dynamic “floor”.
Trading interpretation:
- Strategy: Traders look for selling (short) opportunities when the price approaches or touches the upper resistance line, anticipating a bounce towards the lower support line. Buying (long) opportunities may arise at the support line, but they are considered counter-trend and riskier.
- Breakout: A decisive break below the support line can signal an acceleration of the bearish trend. Conversely, a break above the resistance line indicates a weakening of the trend, a potential reversal, or the start of a new bullish trend.
3. Sideways (Ranging) Channels
A sideways channel, often also called a “rectangle” or “trading range,” forms when the price moves horizontally, bouncing between well-defined support and resistance levels. There is no clear directional trend.
How to draw them:
- Support Line: Connect at least two (ideally three or more) lows at approximately the same horizontal level.
- Resistance Line: Connect at least two (ideally three or more) highs at approximately the same horizontal level. The two lines will be parallel and horizontal.
Trading interpretation:
- Strategy: This is the classic “buy low, sell high” strategy. Traders aim to buy (long) when the price approaches support and sell (short) when it approaches resistance. Trading occurs within the range.
- Breakout: A decisive breakout above resistance or below support indicates that the consolidation phase has ended and a new trend (bullish or bearish) might begin. Breakouts from sideways channels are often powerful and offer great opportunities.
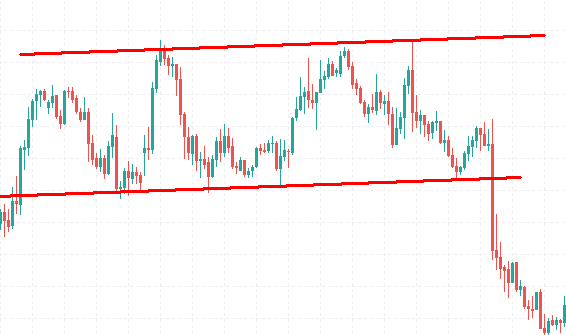 ◎ Canale di Prezzo Laterale: Consolidamento e Breakout (Un grafico che mostra il prezzo che oscilla tra due linee orizzontali parallele di supporto e resistenza, con un successivo breakout.)
Trading Strategies with Price Channels
Identifying a channel is just the first step. The true value lies in using it for your trading decisions.
Trading within the Channel:
- Bounces: Look for entry points when the price touches or approaches one of the channel’s boundary lines. Buy near support in an ascending/sideways channel, sell near resistance in a descending/sideways channel.
- Stop Loss: Place your stop loss just outside the boundary line to limit losses if the channel is broken.
- Profit Target: The take profit can be placed at the opposite boundary line of the channel.
Trading on Breakouts:
- Confirmation: Do not act immediately at the first sign of a break. Wait for confirmation, such as a candlestick closing outside the channel or a retest of the broken level (the old support/resistance becoming the new resistance/support).
- Volume: A significant increase in volume during the breakout can confirm its validity.
- Risk/Reward: Breakouts often offer opportunities with a high risk/reward ratio, but they are also riskier if not managed correctly.
Combining with Other Indicators:
- No technical analysis tool should be used in isolation. Combine price channels with momentum indicators (such as RSI or Stochastic) to confirm bounces, or volume indicators to validate breakouts.
Common Mistakes and Practical Tips
- Don’t Force Channels: Do not try to draw a channel where there isn’t one. A valid channel must have at least two (ideally three) significant contact points on both lines.
- Patience is a Virtue: Wait for the price to clearly interact with the channel lines before acting. False breakouts are common.
- Adapt the Timeframe: Channels can be drawn on any timeframe (from minute to monthly). A channel on a longer timeframe (e.g., daily or weekly) is generally more reliable than one on a very short timeframe.
- Don’t Underestimate Failed Breakouts: Sometimes a breakout fails and the price re-enters the channel. This can indicate a trend strength in the opposite direction and offer trading opportunities.
Conclusion
Price channels are an extremely versatile and powerful technical analysis tool, capable of offering a clear view of market structure. Whether it’s an ascending, descending trend, or a sideways consolidation phase, learning how to draw and interpret these parallel bands will provide you with a valuable map for navigating the markets.
Remember, practice makes perfect. Dedicate time to identifying channels on your favorite charts and observe how the price interacts with them. With proper attention and conscious risk management, price channels can become one of your best allies in the world of trading. Happy trading!